29
/
en
AIzaSyAYiBZKx7MnpbEhh9jyipgxe19OcubqV5w
April 1, 2024
258009
Syrian Arab Republic
SYR
true
2
1
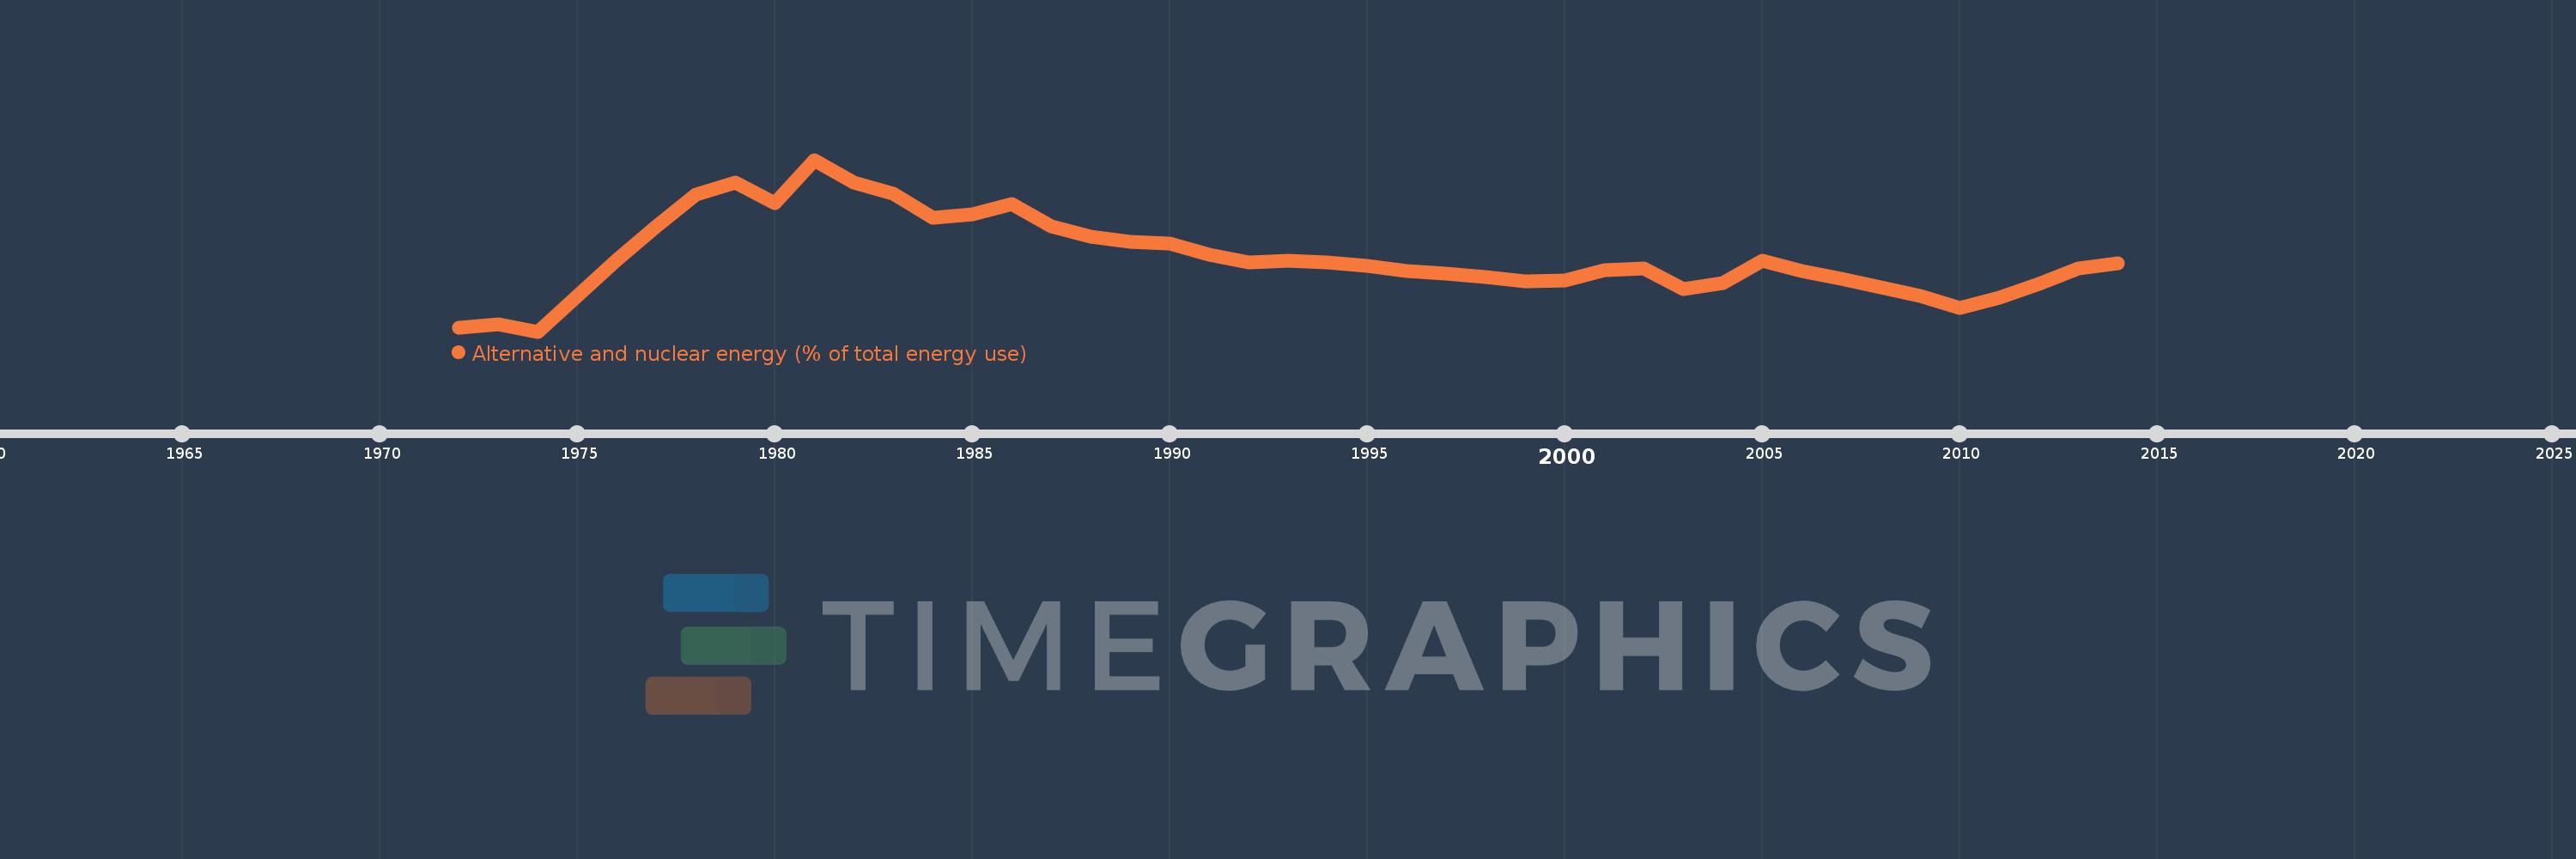
Alternative and nuclear energy (% of total energy use)
2014,2013,2012,2011,2010,2009,2008,2007,2006,2005,2004,2003,2002,2001,2000,1999,1998,1997,1996,1995,1994,1993,1992,1991,1990,1989,1988,1987,1986,1985,1984,1983,1982,1981,1980,1979,1978,1977,1976,1975,1974,1973,1972
This statistics in other country:
AlbaniaAlgeriaAngolaArab WorldArgentinaArmeniaAustraliaAustriaAzerbaijanBahrainBangladeshBelarusBelgiumBeninBoliviaBosnia and HerzegovinaBotswanaBrazilBrunei DarussalamBulgariaCambodiaCameroonCanadaCaribbean small statesCentral Europe and the BalticsChileChinaColombiaCongo, Dem. Rep.Congo, Rep.Costa RicaCote d'IvoireCroatiaCubaCuracaoCyprusCzech RepublicDenmarkDominican RepublicEarly-demographic dividendEast Asia & PacificEast Asia & Pacific (excluding high income)East Asia & Pacific (IDA & IBRD countries)EcuadorEgypt, Arab Rep.El SalvadorEritreaEstoniaEthiopiaEuro areaEurope & Central AsiaEurope & Central Asia (excluding high income)Europe & Central Asia (IDA & IBRD countries)European UnionFinlandFragile and conflict affected situationsFranceGabonGeorgiaGermanyGhanaGibraltarGreeceGuatemalaHaitiHeavily indebted poor countries (HIPC)High incomeHondurasHong Kong SAR, ChinaHungaryIBRD onlyIcelandIDA & IBRD totalIDA blendIDA onlyIDA totalIndiaIndonesiaIran, Islamic Rep.IraqIrelandIsraelItalyJamaicaJapanJordanKazakhstanKenyaKorea, Dem. People’s Rep.Korea, Rep.KosovoKuwaitKyrgyz RepublicLate-demographic dividendLatin America & Caribbean Latin America & Caribbean (excluding high income)Latin America & the Caribbean (IDA & IBRD countries)LatviaLeast developed countries: UN classificationLebanonLibyaLithuaniaLow & middle incomeLow incomeLower middle incomeLuxembourgMacedonia, FYRMalaysiaMaltaMauritiusMexicoMiddle East & North AfricaMiddle East & North Africa (excluding high income)Middle East & North Africa (IDA & IBRD countries)Middle incomeMoldovaMongoliaMontenegroMoroccoMozambiqueMyanmarNamibiaNepalNetherlandsNew ZealandNicaraguaNigerNigeriaNorth AmericaNorwayOECD membersOmanOther small statesPakistanPanamaParaguayPeruPhilippinesPolandPortugalPost-demographic dividendPre-demographic dividendQatarRomaniaRussian FederationSaudi ArabiaSenegalSerbiaSingaporeSlovak RepublicSloveniaSmall statesSouth AfricaSouth AsiaSouth Asia (IDA & IBRD)South SudanSpainSri LankaSub-Saharan Africa Sub-Saharan Africa (excluding high income)Sub-Saharan Africa (IDA & IBRD countries)SudanSwedenSwitzerlandSyrian Arab RepublicTajikistanTanzaniaThailandTogoTrinidad and TobagoTunisiaTurkeyTurkmenistanUkraineUnited Arab EmiratesUnited KingdomUnited StatesUpper middle incomeUruguayUzbekistanVenezuela, RBVietnamWorldYemen, Rep.ZambiaZimbabwe Timeline:
This timeline shows a graph from 1972 to 2014 of Syrian Arab Republic. No data until 1971. Number of actual observations by date: 43.
Source name:
World Development Indicators
Source organization:
IEA Statistics © OECD/IEA 2014 (http://www.iea.org/stats/index.asp), subject to https://www.iea.org/t&c/termsandconditions/
Categories, topics:
Energy & Mining
Last updated:
apr 23, 2017
Indicators value changes by year
At the date of observation
Value
Absolute change
Change from previous value
jan 1, 1972
0.184
+0.184
0.0%
jan 1, 1973
0.269
+0.085
46.05%
jan 1, 1974
0.071
-0.198
-73.63%
jan 1, 1975
1.072
+1.001
1.41K%
jan 1, 1976
2.113
+1.04
97.04%
jan 1, 1977
3.06
+0.947
44.81%
jan 1, 1978
3.956
+0.897
29.31%
jan 1, 1979
4.288
+0.332
8.39%
jan 1, 1980
3.711
-0.578
-13.47%
jan 1, 1981
4.933
+1.222
32.93%
jan 1, 1982
4.287
-0.645
-13.08%
jan 1, 1983
3.979
-0.308
-7.19%
jan 1, 1984
3.286
-0.693
-17.42%
jan 1, 1985
3.388
+0.102
3.09%
jan 1, 1986
3.67
+0.282
8.32%
jan 1, 1987
3.058
-0.612
-16.68%
jan 1, 1988
2.75
-0.308
-10.08%
jan 1, 1989
2.614
-0.136
-4.94%
jan 1, 1990
2.563
-0.05
-1.93%
jan 1, 1991
2.242
-0.322
-12.55%
jan 1, 1992
2.024
-0.217
-9.7%
jan 1, 1993
2.081
+0.057
2.81%
jan 1, 1994
2.036
-0.045
-2.16%
jan 1, 1995
1.919
-0.118
-5.78%
jan 1, 1996
1.784
-0.134
-7.0%
jan 1, 1997
1.717
-0.067
-3.78%
jan 1, 1998
1.612
-0.105
-6.1%
jan 1, 1999
1.502
-0.11
-6.81%
jan 1, 2000
1.52
+0.018
1.19%
jan 1, 2001
1.8
+0.279
18.37%
jan 1, 2002
1.851
+0.052
2.88%
jan 1, 2003
1.281
-0.571
-30.83%
jan 1, 2004
1.434
+0.153
11.96%
jan 1, 2005
2.077
+0.643
44.84%
jan 1, 2006
1.789
-0.288
-13.86%
jan 1, 2007
1.569
-0.22
-12.32%
jan 1, 2008
1.321
-0.247
-15.78%
jan 1, 2009
1.068
-0.253
-19.15%
jan 1, 2010
0.747
-0.321
-30.09%
jan 1, 2011
1.029
+0.282
37.83%
jan 1, 2012
1.413
+0.384
37.3%
jan 1, 2013
1.86
+0.447
31.61%
jan 1, 2014
1.998
+0.139
7.47%
Ranking of countries by current statistics by years


Comments: