29
/
en
AIzaSyAYiBZKx7MnpbEhh9jyipgxe19OcubqV5w
April 1, 2024
207682
Netherlands
NLD
true
2
1
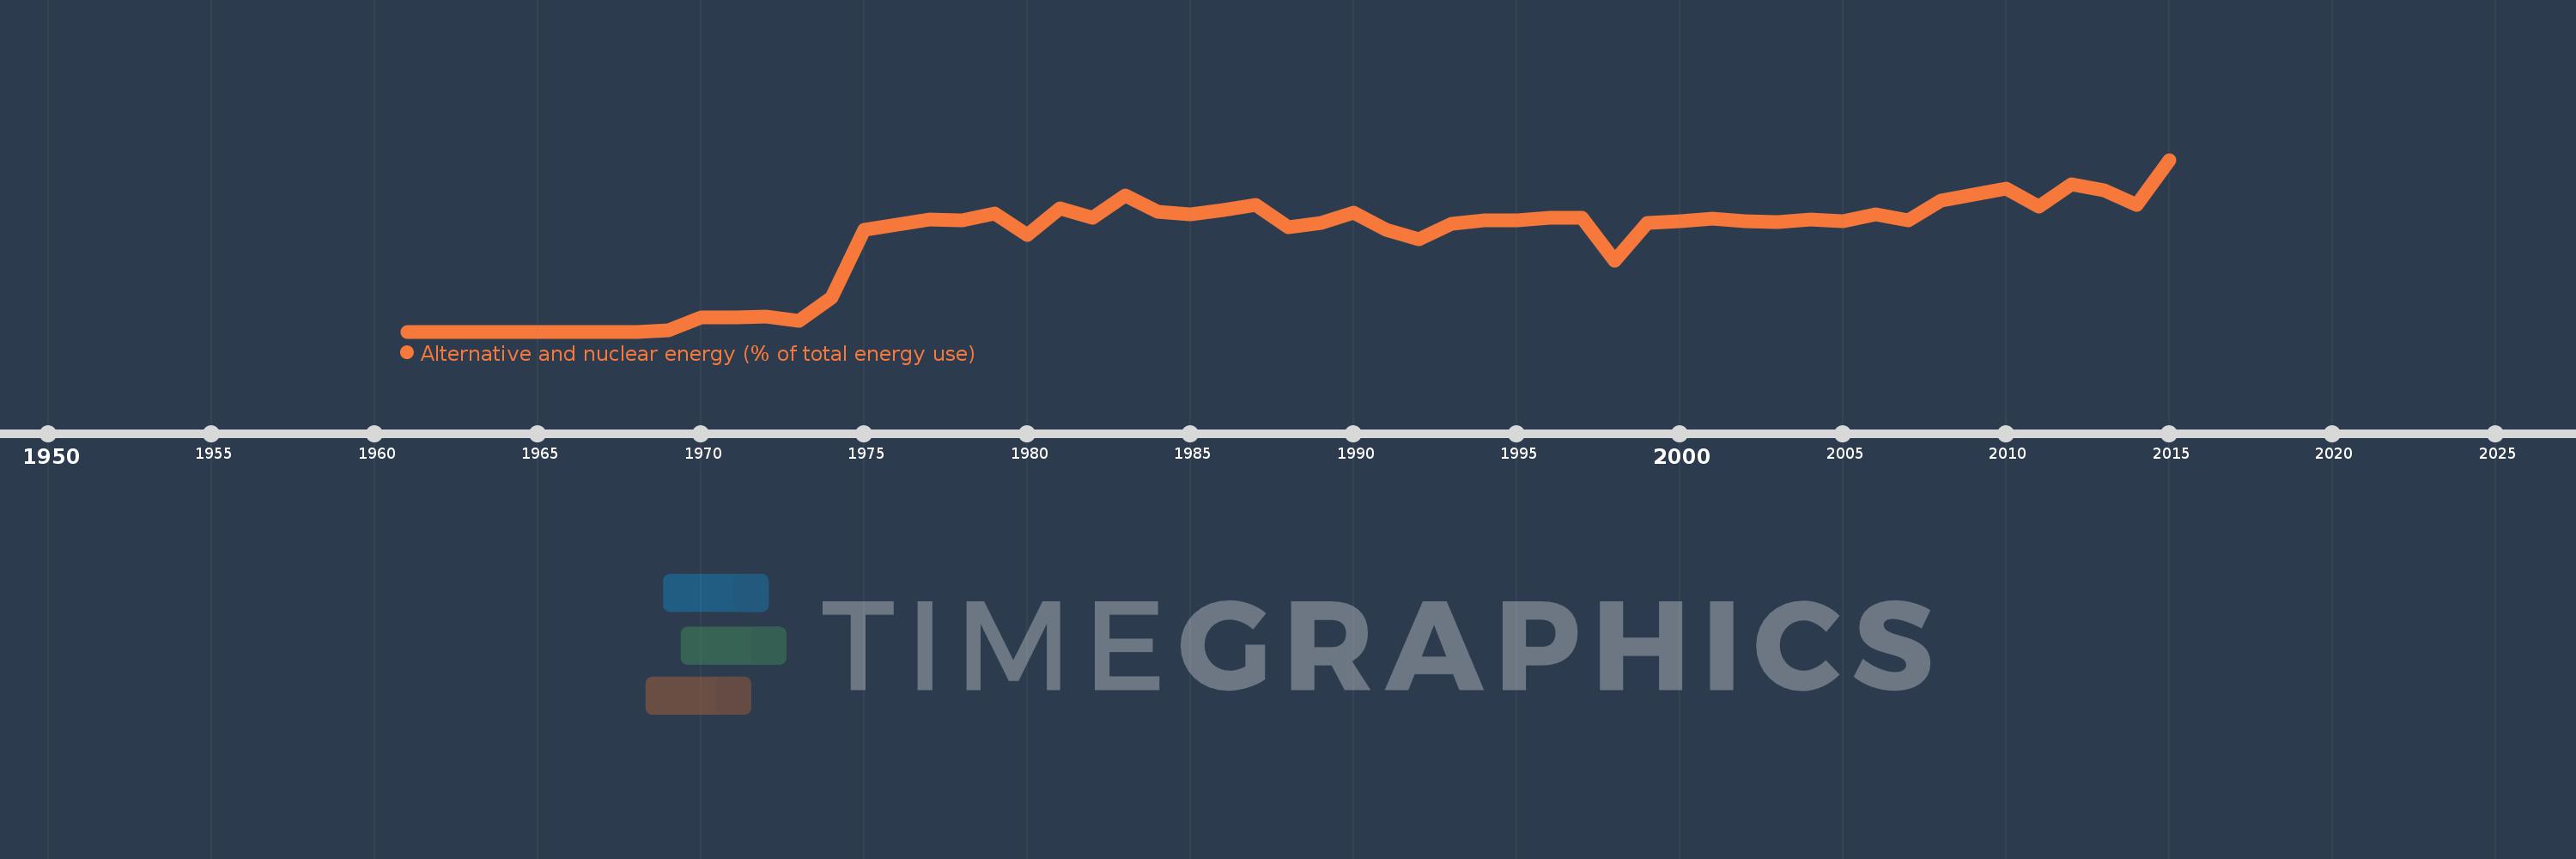
Alternative and nuclear energy (% of total energy use)
2015,2014,2013,2012,2011,2010,2009,2008,2007,2006,2005,2004,2003,2002,2001,2000,1999,1998,1997,1996,1995,1994,1993,1992,1991,1990,1989,1988,1987,1986,1985,1984,1983,1982,1981,1980,1979,1978,1977,1976,1975,1974,1973,1972,1971,1970,1969,1968,1967,1966,1965,1964,1963,1962,1961
This statistics in other country:
AlbaniaAlgeriaAngolaArab WorldArgentinaArmeniaAustraliaAustriaAzerbaijanBahrainBangladeshBelarusBelgiumBeninBoliviaBosnia and HerzegovinaBotswanaBrazilBrunei DarussalamBulgariaCambodiaCameroonCanadaCaribbean small statesCentral Europe and the BalticsChileChinaColombiaCongo, Dem. Rep.Congo, Rep.Costa RicaCote d'IvoireCroatiaCubaCuracaoCyprusCzech RepublicDenmarkDominican RepublicEarly-demographic dividendEast Asia & PacificEast Asia & Pacific (excluding high income)East Asia & Pacific (IDA & IBRD countries)EcuadorEgypt, Arab Rep.El SalvadorEritreaEstoniaEthiopiaEuro areaEurope & Central AsiaEurope & Central Asia (excluding high income)Europe & Central Asia (IDA & IBRD countries)European UnionFinlandFragile and conflict affected situationsFranceGabonGeorgiaGermanyGhanaGibraltarGreeceGuatemalaHaitiHeavily indebted poor countries (HIPC)High incomeHondurasHong Kong SAR, ChinaHungaryIBRD onlyIcelandIDA & IBRD totalIDA blendIDA onlyIDA totalIndiaIndonesiaIran, Islamic Rep.IraqIrelandIsraelItalyJamaicaJapanJordanKazakhstanKenyaKorea, Dem. People’s Rep.Korea, Rep.KosovoKuwaitKyrgyz RepublicLate-demographic dividendLatin America & Caribbean Latin America & Caribbean (excluding high income)Latin America & the Caribbean (IDA & IBRD countries)LatviaLeast developed countries: UN classificationLebanonLibyaLithuaniaLow & middle incomeLow incomeLower middle incomeLuxembourgMacedonia, FYRMalaysiaMaltaMauritiusMexicoMiddle East & North AfricaMiddle East & North Africa (excluding high income)Middle East & North Africa (IDA & IBRD countries)Middle incomeMoldovaMongoliaMontenegroMoroccoMozambiqueMyanmarNamibiaNepalNetherlandsNew ZealandNicaraguaNigerNigeriaNorth AmericaNorwayOECD membersOmanOther small statesPakistanPanamaParaguayPeruPhilippinesPolandPortugalPost-demographic dividendPre-demographic dividendQatarRomaniaRussian FederationSaudi ArabiaSenegalSerbiaSingaporeSlovak RepublicSloveniaSmall statesSouth AfricaSouth AsiaSouth Asia (IDA & IBRD)South SudanSpainSri LankaSub-Saharan Africa Sub-Saharan Africa (excluding high income)Sub-Saharan Africa (IDA & IBRD countries)SudanSwedenSwitzerlandSyrian Arab RepublicTajikistanTanzaniaThailandTogoTrinidad and TobagoTunisiaTurkeyTurkmenistanUkraineUnited Arab EmiratesUnited KingdomUnited StatesUpper middle incomeUruguayUzbekistanVenezuela, RBVietnamWorldYemen, Rep.ZambiaZimbabwe Timeline:
This timeline shows a graph from 1961 to 2015 of Netherlands. No data until 1960. Number of actual observations by date: 55.
Source name:
World Development Indicators
Source organization:
IEA Statistics © OECD/IEA 2014 (http://www.iea.org/stats/index.asp), subject to https://www.iea.org/t&c/termsandconditions/
Categories, topics:
Energy & Mining
Last updated:
apr 23, 2017
Indicators value changes by year
At the date of observation
Value
Absolute change
Change from previous value
jan 1, 1969
0.019
+0.019
%
jan 1, 1970
0.19
+0.171
906.23%
jan 1, 1971
0.195
+0.006
3.04%
jan 1, 1972
0.207
+0.012
6.22%
jan 1, 1973
0.145
-0.062
-29.88%
jan 1, 1974
0.466
+0.32
220.11%
jan 1, 1975
1.401
+0.935
200.74%
jan 1, 1976
1.473
+0.072
5.13%
jan 1, 1977
1.545
+0.072
4.89%
jan 1, 1978
1.53
-0.014
-0.94%
jan 1, 1979
1.628
+0.098
6.38%
jan 1, 1980
1.33
-0.297
-18.27%
jan 1, 1981
1.701
+0.37
27.83%
jan 1, 1982
1.567
-0.133
-7.84%
jan 1, 1983
1.875
+0.307
19.61%
jan 1, 1984
1.654
-0.221
-11.77%
jan 1, 1985
1.617
-0.038
-2.27%
jan 1, 1986
1.676
+0.06
3.69%
jan 1, 1987
1.747
+0.071
4.23%
jan 1, 1988
1.441
-0.306
-17.53%
jan 1, 1989
1.506
+0.066
4.55%
jan 1, 1990
1.642
+0.136
9.0%
jan 1, 1991
1.411
-0.231
-14.05%
jan 1, 1992
1.278
-0.133
-9.43%
jan 1, 1993
1.487
+0.209
16.33%
jan 1, 1994
1.531
+0.044
2.95%
jan 1, 1995
1.538
+0.007
0.48%
jan 1, 1996
1.572
+0.034
2.2%
jan 1, 1997
1.572
+0.0
0.01%
jan 1, 1998
0.984
-0.588
-37.42%
jan 1, 1999
1.502
+0.518
52.65%
jan 1, 2000
1.521
+0.019
1.27%
jan 1, 2001
1.556
+0.035
2.3%
jan 1, 2002
1.523
-0.033
-2.13%
jan 1, 2003
1.514
-0.009
-0.58%
jan 1, 2004
1.543
+0.029
1.93%
jan 1, 2005
1.52
-0.023
-1.48%
jan 1, 2006
1.621
+0.101
6.63%
jan 1, 2007
1.539
-0.082
-5.03%
jan 1, 2008
1.811
+0.272
17.65%
jan 1, 2009
1.886
+0.075
4.14%
jan 1, 2010
1.976
+0.09
4.79%
jan 1, 2011
1.722
-0.254
-12.87%
jan 1, 2012
2.036
+0.314
18.25%
jan 1, 2013
1.946
-0.09
-4.41%
jan 1, 2014
1.747
-0.2
-10.26%
jan 1, 2015
2.372
+0.625
35.77%
Ranking of countries by current statistics by years


Comments: