29
/
en
AIzaSyAYiBZKx7MnpbEhh9jyipgxe19OcubqV5w
April 1, 2024
261872
Thailand
THA
true
2
1
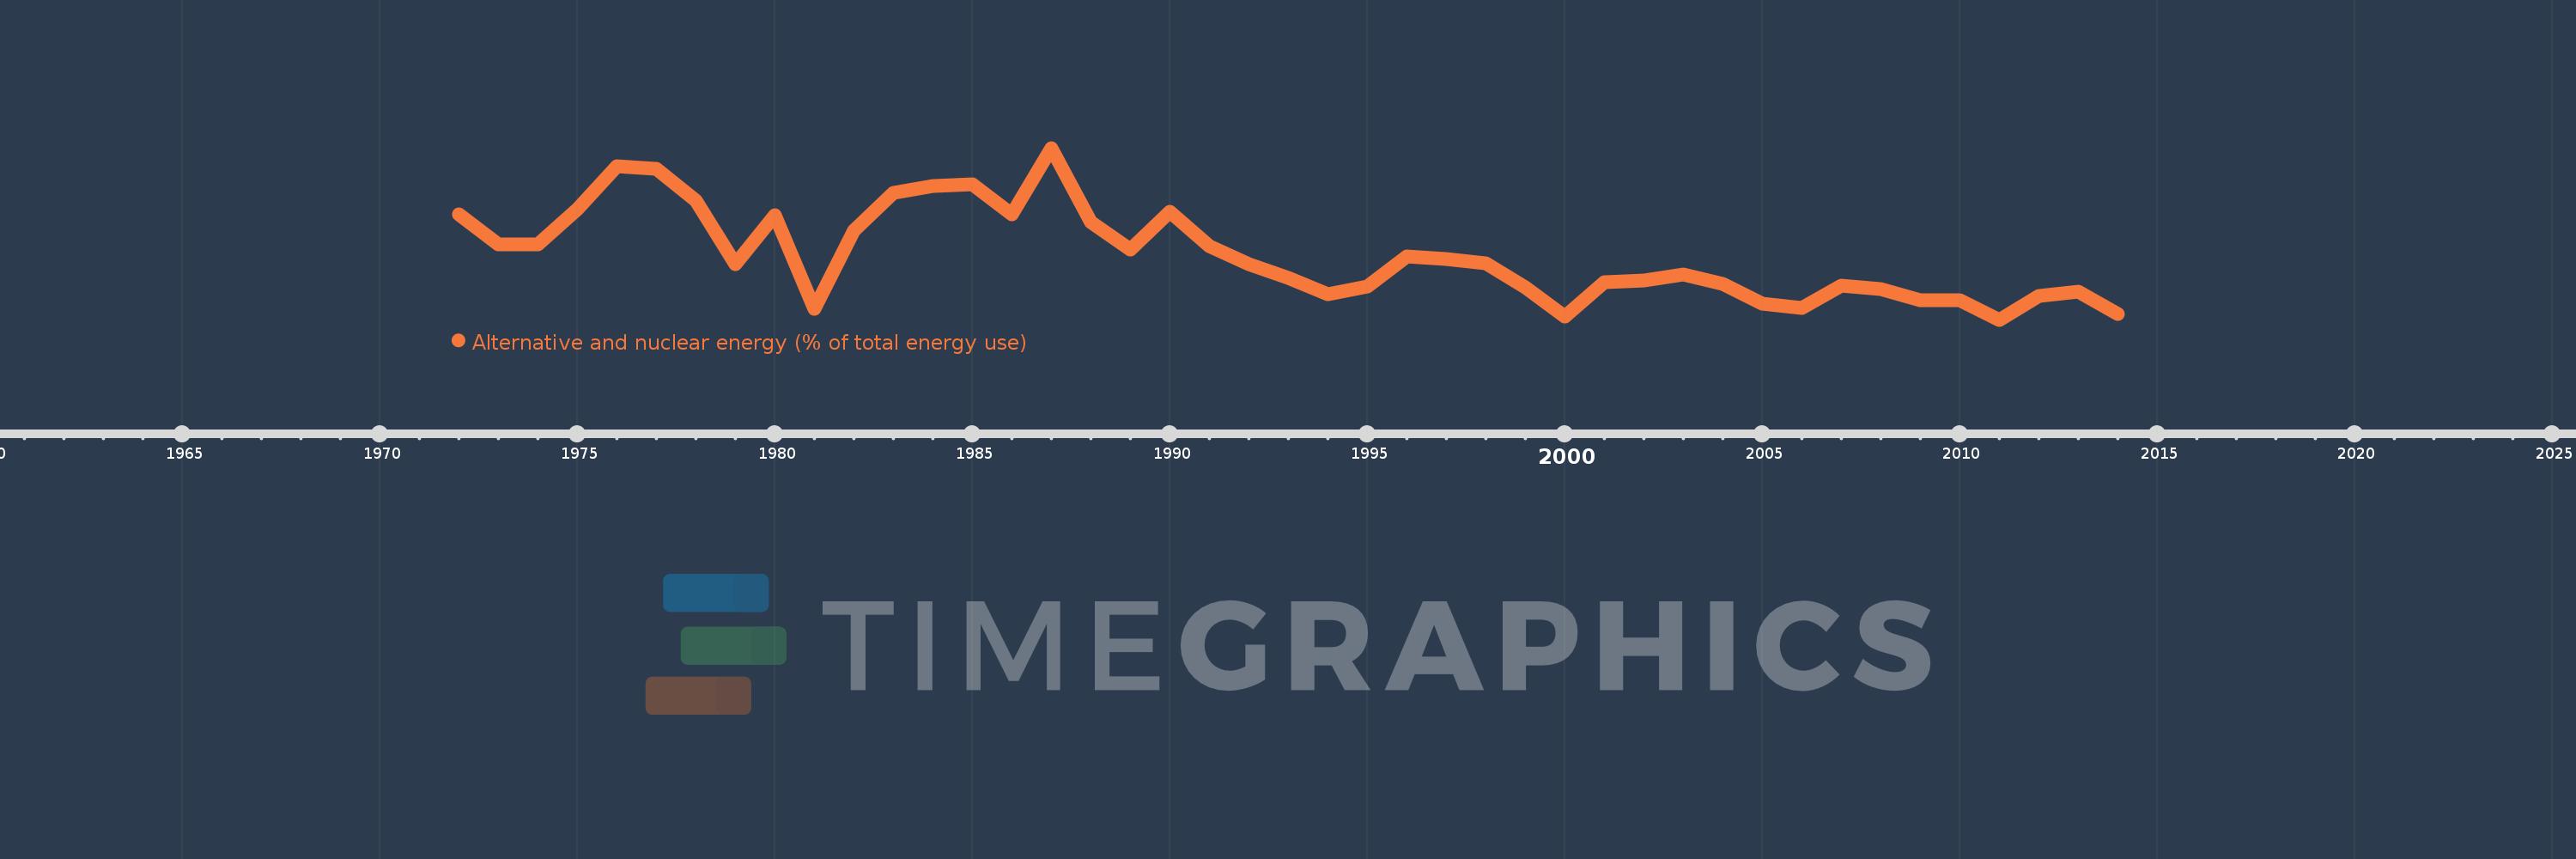
Alternative and nuclear energy (% of total energy use)
2014,2013,2012,2011,2010,2009,2008,2007,2006,2005,2004,2003,2002,2001,2000,1999,1998,1997,1996,1995,1994,1993,1992,1991,1990,1989,1988,1987,1986,1985,1984,1983,1982,1981,1980,1979,1978,1977,1976,1975,1974,1973,1972
This statistics in other country:
AlbaniaAlgeriaAngolaArab WorldArgentinaArmeniaAustraliaAustriaAzerbaijanBahrainBangladeshBelarusBelgiumBeninBoliviaBosnia and HerzegovinaBotswanaBrazilBrunei DarussalamBulgariaCambodiaCameroonCanadaCaribbean small statesCentral Europe and the BalticsChileChinaColombiaCongo, Dem. Rep.Congo, Rep.Costa RicaCote d'IvoireCroatiaCubaCuracaoCyprusCzech RepublicDenmarkDominican RepublicEarly-demographic dividendEast Asia & PacificEast Asia & Pacific (excluding high income)East Asia & Pacific (IDA & IBRD countries)EcuadorEgypt, Arab Rep.El SalvadorEritreaEstoniaEthiopiaEuro areaEurope & Central AsiaEurope & Central Asia (excluding high income)Europe & Central Asia (IDA & IBRD countries)European UnionFinlandFragile and conflict affected situationsFranceGabonGeorgiaGermanyGhanaGibraltarGreeceGuatemalaHaitiHeavily indebted poor countries (HIPC)High incomeHondurasHong Kong SAR, ChinaHungaryIBRD onlyIcelandIDA & IBRD totalIDA blendIDA onlyIDA totalIndiaIndonesiaIran, Islamic Rep.IraqIrelandIsraelItalyJamaicaJapanJordanKazakhstanKenyaKorea, Dem. People’s Rep.Korea, Rep.KosovoKuwaitKyrgyz RepublicLate-demographic dividendLatin America & Caribbean Latin America & Caribbean (excluding high income)Latin America & the Caribbean (IDA & IBRD countries)LatviaLeast developed countries: UN classificationLebanonLibyaLithuaniaLow & middle incomeLow incomeLower middle incomeLuxembourgMacedonia, FYRMalaysiaMaltaMauritiusMexicoMiddle East & North AfricaMiddle East & North Africa (excluding high income)Middle East & North Africa (IDA & IBRD countries)Middle incomeMoldovaMongoliaMontenegroMoroccoMozambiqueMyanmarNamibiaNepalNetherlandsNew ZealandNicaraguaNigerNigeriaNorth AmericaNorwayOECD membersOmanOther small statesPakistanPanamaParaguayPeruPhilippinesPolandPortugalPost-demographic dividendPre-demographic dividendQatarRomaniaRussian FederationSaudi ArabiaSenegalSerbiaSingaporeSlovak RepublicSloveniaSmall statesSouth AfricaSouth AsiaSouth Asia (IDA & IBRD)South SudanSpainSri LankaSub-Saharan Africa Sub-Saharan Africa (excluding high income)Sub-Saharan Africa (IDA & IBRD countries)SudanSwedenSwitzerlandSyrian Arab RepublicTajikistanTanzaniaThailandTogoTrinidad and TobagoTunisiaTurkeyTurkmenistanUkraineUnited Arab EmiratesUnited KingdomUnited StatesUpper middle incomeUruguayUzbekistanVenezuela, RBVietnamWorldYemen, Rep.ZambiaZimbabwe Timeline:
This timeline shows a graph from 1972 to 2014 of Thailand. No data until 1971. Number of actual observations by date: 43.
Source name:
World Development Indicators
Source organization:
IEA Statistics © OECD/IEA 2014 (http://www.iea.org/stats/index.asp), subject to https://www.iea.org/t&c/termsandconditions/
Categories, topics:
Energy & Mining
Last updated:
apr 23, 2017
Indicators value changes by year
At the date of observation
Value
Absolute change
Change from previous value
jan 1, 1972
1.287
+1.287
0.0%
jan 1, 1973
1.034
-0.252
-19.62%
jan 1, 1974
1.036
+0.002
0.17%
jan 1, 1975
1.326
+0.29
28.01%
jan 1, 1976
1.686
+0.36
27.12%
jan 1, 1977
1.661
-0.025
-1.49%
jan 1, 1978
1.4
-0.26
-15.69%
jan 1, 1979
0.871
-0.529
-37.81%
jan 1, 1980
1.275
+0.404
46.4%
jan 1, 1981
0.498
-0.777
-60.97%
jan 1, 1982
1.15
+0.652
131.13%
jan 1, 1983
1.467
+0.317
27.56%
jan 1, 1984
1.524
+0.057
3.85%
jan 1, 1985
1.538
+0.015
0.98%
jan 1, 1986
1.283
-0.255
-16.6%
jan 1, 1987
1.838
+0.555
43.25%
jan 1, 1988
1.221
-0.617
-33.58%
jan 1, 1989
0.993
-0.228
-18.69%
jan 1, 1990
1.308
+0.316
31.78%
jan 1, 1991
1.022
-0.286
-21.87%
jan 1, 1992
0.868
-0.154
-15.1%
jan 1, 1993
0.753
-0.115
-13.25%
jan 1, 1994
0.623
-0.129
-17.19%
jan 1, 1995
0.687
+0.064
10.22%
jan 1, 1996
0.934
+0.246
35.87%
jan 1, 1997
0.914
-0.019
-2.08%
jan 1, 1998
0.88
-0.034
-3.7%
jan 1, 1999
0.676
-0.205
-23.23%
jan 1, 2000
0.433
-0.243
-35.94%
jan 1, 2001
0.719
+0.286
66.16%
jan 1, 2002
0.731
+0.012
1.63%
jan 1, 2003
0.783
+0.052
7.13%
jan 1, 2004
0.706
-0.077
-9.81%
jan 1, 2005
0.541
-0.165
-23.38%
jan 1, 2006
0.505
-0.036
-6.62%
jan 1, 2007
0.694
+0.189
37.31%
jan 1, 2008
0.665
-0.029
-4.2%
jan 1, 2009
0.567
-0.098
-14.73%
jan 1, 2010
0.572
+0.005
0.96%
jan 1, 2011
0.407
-0.165
-28.89%
jan 1, 2012
0.604
+0.197
48.52%
jan 1, 2013
0.64
+0.036
5.95%
jan 1, 2014
0.458
-0.182
-28.46%
Ranking of countries by current statistics by years


Comments: