29
/
en
AIzaSyAYiBZKx7MnpbEhh9jyipgxe19OcubqV5w
April 1, 2024
193893
Mauritius
MUS
true
2
1
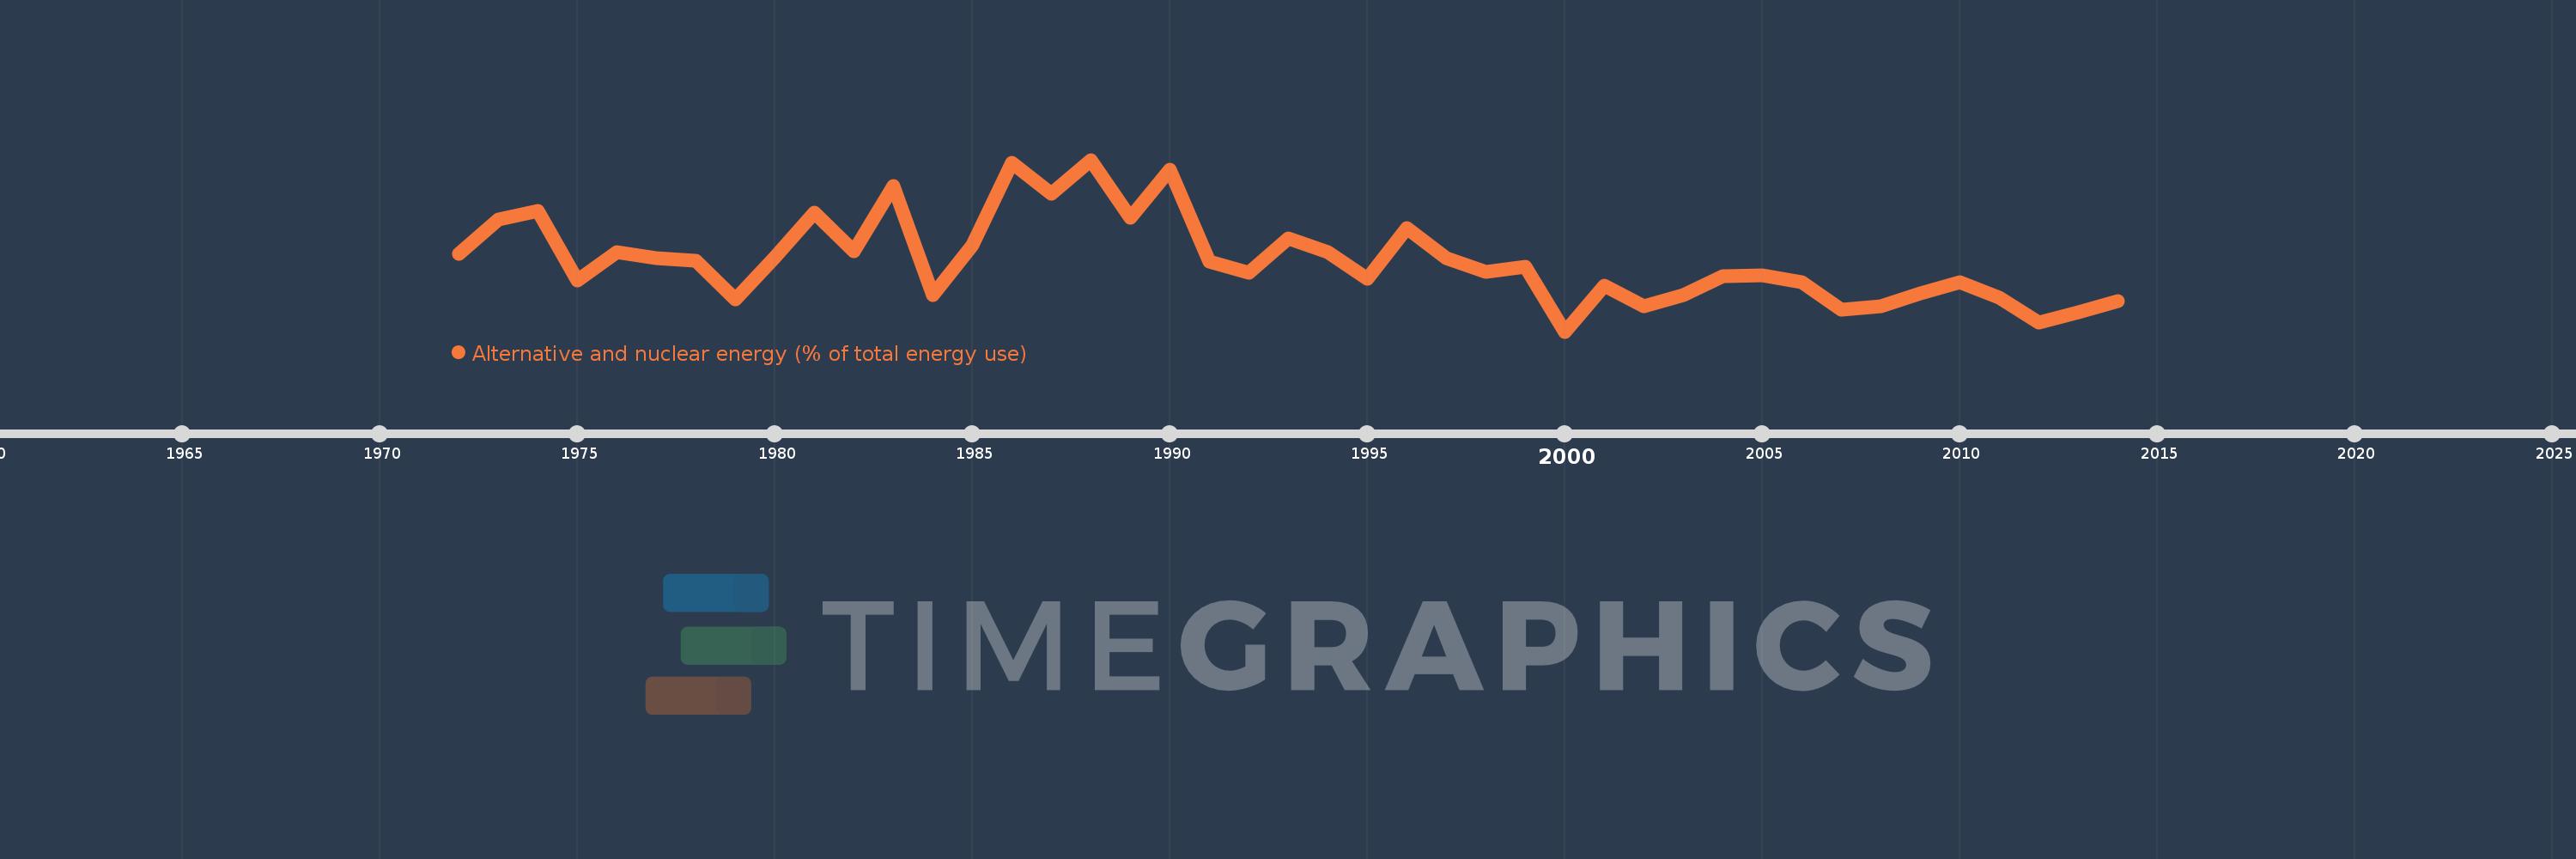
Alternative and nuclear energy (% of total energy use)
2014,2013,2012,2011,2010,2009,2008,2007,2006,2005,2004,2003,2002,2001,2000,1999,1998,1997,1996,1995,1994,1993,1992,1991,1990,1989,1988,1987,1986,1985,1984,1983,1982,1981,1980,1979,1978,1977,1976,1975,1974,1973,1972
This statistics in other country:
AlbaniaAlgeriaAngolaArab WorldArgentinaArmeniaAustraliaAustriaAzerbaijanBahrainBangladeshBelarusBelgiumBeninBoliviaBosnia and HerzegovinaBotswanaBrazilBrunei DarussalamBulgariaCambodiaCameroonCanadaCaribbean small statesCentral Europe and the BalticsChileChinaColombiaCongo, Dem. Rep.Congo, Rep.Costa RicaCote d'IvoireCroatiaCubaCuracaoCyprusCzech RepublicDenmarkDominican RepublicEarly-demographic dividendEast Asia & PacificEast Asia & Pacific (excluding high income)East Asia & Pacific (IDA & IBRD countries)EcuadorEgypt, Arab Rep.El SalvadorEritreaEstoniaEthiopiaEuro areaEurope & Central AsiaEurope & Central Asia (excluding high income)Europe & Central Asia (IDA & IBRD countries)European UnionFinlandFragile and conflict affected situationsFranceGabonGeorgiaGermanyGhanaGibraltarGreeceGuatemalaHaitiHeavily indebted poor countries (HIPC)High incomeHondurasHong Kong SAR, ChinaHungaryIBRD onlyIcelandIDA & IBRD totalIDA blendIDA onlyIDA totalIndiaIndonesiaIran, Islamic Rep.IraqIrelandIsraelItalyJamaicaJapanJordanKazakhstanKenyaKorea, Dem. People’s Rep.Korea, Rep.KosovoKuwaitKyrgyz RepublicLate-demographic dividendLatin America & Caribbean Latin America & Caribbean (excluding high income)Latin America & the Caribbean (IDA & IBRD countries)LatviaLeast developed countries: UN classificationLebanonLibyaLithuaniaLow & middle incomeLow incomeLower middle incomeLuxembourgMacedonia, FYRMalaysiaMaltaMauritiusMexicoMiddle East & North AfricaMiddle East & North Africa (excluding high income)Middle East & North Africa (IDA & IBRD countries)Middle incomeMoldovaMongoliaMontenegroMoroccoMozambiqueMyanmarNamibiaNepalNetherlandsNew ZealandNicaraguaNigerNigeriaNorth AmericaNorwayOECD membersOmanOther small statesPakistanPanamaParaguayPeruPhilippinesPolandPortugalPost-demographic dividendPre-demographic dividendQatarRomaniaRussian FederationSaudi ArabiaSenegalSerbiaSingaporeSlovak RepublicSloveniaSmall statesSouth AfricaSouth AsiaSouth Asia (IDA & IBRD)South SudanSpainSri LankaSub-Saharan Africa Sub-Saharan Africa (excluding high income)Sub-Saharan Africa (IDA & IBRD countries)SudanSwedenSwitzerlandSyrian Arab RepublicTajikistanTanzaniaThailandTogoTrinidad and TobagoTunisiaTurkeyTurkmenistanUkraineUnited Arab EmiratesUnited KingdomUnited StatesUpper middle incomeUruguayUzbekistanVenezuela, RBVietnamWorldYemen, Rep.ZambiaZimbabwe Timeline:
This timeline shows a graph from 1972 to 2014 of Mauritius. No data until 1971. Number of actual observations by date: 43.
Source name:
World Development Indicators
Source organization:
IEA Statistics © OECD/IEA 2014 (http://www.iea.org/stats/index.asp), subject to https://www.iea.org/t&c/termsandconditions/
Categories, topics:
Energy & Mining
Last updated:
apr 23, 2017
Indicators value changes by year
At the date of observation
Value
Absolute change
Change from previous value
jan 1, 1972
1.181
+1.181
0.0%
jan 1, 1973
1.578
+0.396
33.56%
jan 1, 1974
1.678
+0.1
6.34%
jan 1, 1975
0.872
-0.805
-47.99%
jan 1, 1976
1.204
+0.332
38.01%
jan 1, 1977
1.135
-0.069
-5.73%
jan 1, 1978
1.102
-0.033
-2.89%
jan 1, 1979
0.658
-0.444
-40.3%
jan 1, 1980
1.144
+0.486
73.9%
jan 1, 1981
1.658
+0.513
44.86%
jan 1, 1982
1.211
-0.447
-26.97%
jan 1, 1983
1.965
+0.754
62.29%
jan 1, 1984
0.704
-1.26
-64.15%
jan 1, 1985
1.279
+0.574
81.55%
jan 1, 1986
2.237
+0.958
74.95%
jan 1, 1987
1.875
-0.363
-16.21%
jan 1, 1988
2.27
+0.395
21.08%
jan 1, 1989
1.604
-0.666
-29.33%
jan 1, 1990
2.158
+0.554
34.52%
jan 1, 1991
1.097
-1.061
-49.16%
jan 1, 1992
0.963
-0.134
-12.25%
jan 1, 1993
1.362
+0.4
41.53%
jan 1, 1994
1.201
-0.162
-11.87%
jan 1, 1995
0.893
-0.308
-25.61%
jan 1, 1996
1.484
+0.591
66.16%
jan 1, 1997
1.134
-0.35
-23.59%
jan 1, 1998
0.977
-0.156
-13.8%
jan 1, 1999
1.037
+0.059
6.08%
jan 1, 2000
0.283
-0.754
-72.7%
jan 1, 2001
0.817
+0.534
188.64%
jan 1, 2002
0.576
-0.242
-29.56%
jan 1, 2003
0.703
+0.128
22.16%
jan 1, 2004
0.92
+0.217
30.85%
jan 1, 2005
0.934
+0.014
1.54%
jan 1, 2006
0.851
-0.083
-8.86%
jan 1, 2007
0.533
-0.318
-37.38%
jan 1, 2008
0.578
+0.045
8.48%
jan 1, 2009
0.727
+0.148
25.66%
jan 1, 2010
0.855
+0.129
17.68%
jan 1, 2011
0.679
-0.176
-20.61%
jan 1, 2012
0.385
-0.294
-43.36%
jan 1, 2013
0.507
+0.122
31.74%
jan 1, 2014
0.637
+0.13
25.66%
Ranking of countries by current statistics by years


Comments: