29
/
en
AIzaSyAYiBZKx7MnpbEhh9jyipgxe19OcubqV5w
April 1, 2024
152245
Hungary
HUN
true
2
1
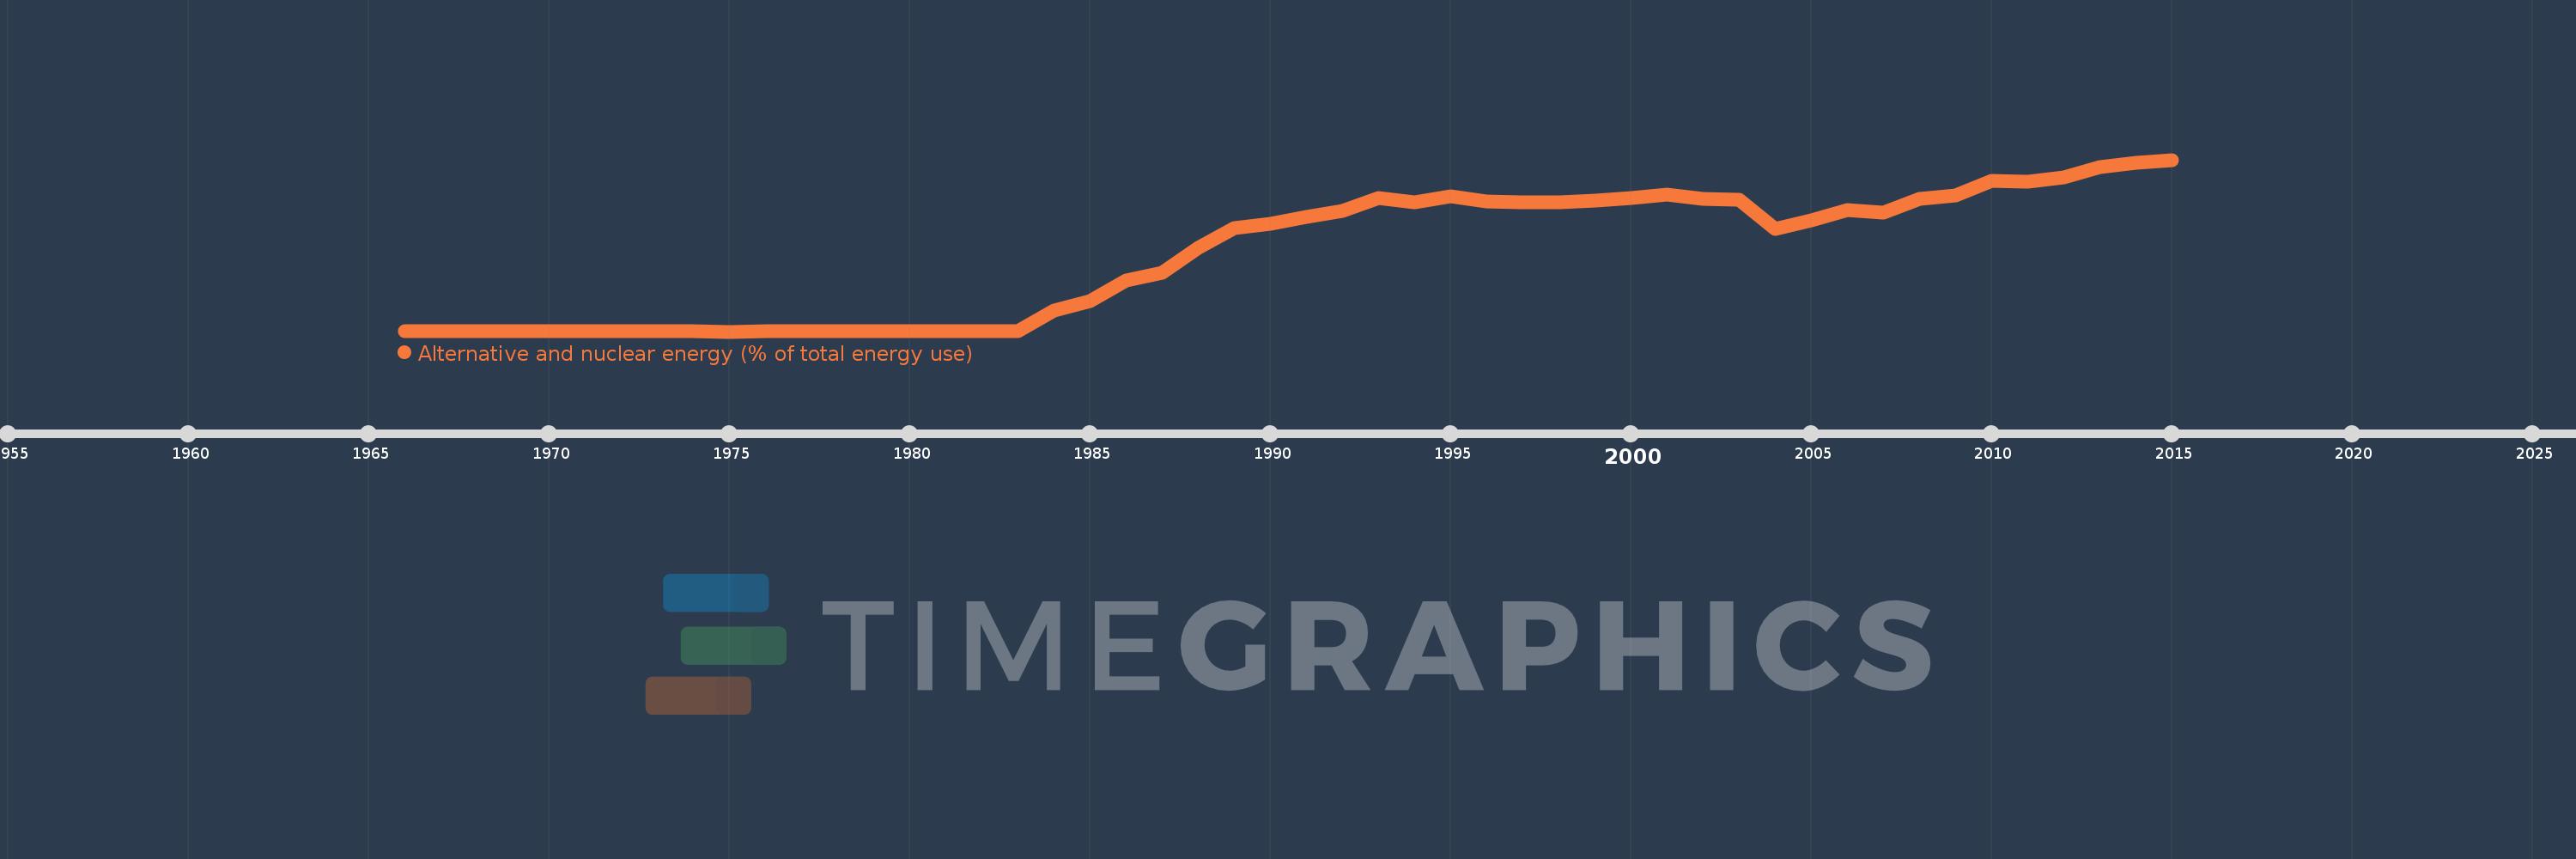
Alternative and nuclear energy (% of total energy use)
2015,2014,2013,2012,2011,2010,2009,2008,2007,2006,2005,2004,2003,2002,2001,2000,1999,1998,1997,1996,1995,1994,1993,1992,1991,1990,1989,1988,1987,1986,1985,1984,1983,1982,1981,1980,1979,1978,1977,1976,1975,1974,1973,1972,1971,1970,1969,1968,1967,1966
This statistics in other country:
AlbaniaAlgeriaAngolaArab WorldArgentinaArmeniaAustraliaAustriaAzerbaijanBahrainBangladeshBelarusBelgiumBeninBoliviaBosnia and HerzegovinaBotswanaBrazilBrunei DarussalamBulgariaCambodiaCameroonCanadaCaribbean small statesCentral Europe and the BalticsChileChinaColombiaCongo, Dem. Rep.Congo, Rep.Costa RicaCote d'IvoireCroatiaCubaCuracaoCyprusCzech RepublicDenmarkDominican RepublicEarly-demographic dividendEast Asia & PacificEast Asia & Pacific (excluding high income)East Asia & Pacific (IDA & IBRD countries)EcuadorEgypt, Arab Rep.El SalvadorEritreaEstoniaEthiopiaEuro areaEurope & Central AsiaEurope & Central Asia (excluding high income)Europe & Central Asia (IDA & IBRD countries)European UnionFinlandFragile and conflict affected situationsFranceGabonGeorgiaGermanyGhanaGibraltarGreeceGuatemalaHaitiHeavily indebted poor countries (HIPC)High incomeHondurasHong Kong SAR, ChinaHungaryIBRD onlyIcelandIDA & IBRD totalIDA blendIDA onlyIDA totalIndiaIndonesiaIran, Islamic Rep.IraqIrelandIsraelItalyJamaicaJapanJordanKazakhstanKenyaKorea, Dem. People’s Rep.Korea, Rep.KosovoKuwaitKyrgyz RepublicLate-demographic dividendLatin America & Caribbean Latin America & Caribbean (excluding high income)Latin America & the Caribbean (IDA & IBRD countries)LatviaLeast developed countries: UN classificationLebanonLibyaLithuaniaLow & middle incomeLow incomeLower middle incomeLuxembourgMacedonia, FYRMalaysiaMaltaMauritiusMexicoMiddle East & North AfricaMiddle East & North Africa (excluding high income)Middle East & North Africa (IDA & IBRD countries)Middle incomeMoldovaMongoliaMontenegroMoroccoMozambiqueMyanmarNamibiaNepalNetherlandsNew ZealandNicaraguaNigerNigeriaNorth AmericaNorwayOECD membersOmanOther small statesPakistanPanamaParaguayPeruPhilippinesPolandPortugalPost-demographic dividendPre-demographic dividendQatarRomaniaRussian FederationSaudi ArabiaSenegalSerbiaSingaporeSlovak RepublicSloveniaSmall statesSouth AfricaSouth AsiaSouth Asia (IDA & IBRD)South SudanSpainSri LankaSub-Saharan Africa Sub-Saharan Africa (excluding high income)Sub-Saharan Africa (IDA & IBRD countries)SudanSwedenSwitzerlandSyrian Arab RepublicTajikistanTanzaniaThailandTogoTrinidad and TobagoTunisiaTurkeyTurkmenistanUkraineUnited Arab EmiratesUnited KingdomUnited StatesUpper middle incomeUruguayUzbekistanVenezuela, RBVietnamWorldYemen, Rep.ZambiaZimbabwe Timeline:
This timeline shows a graph from 1966 to 2015 of Hungary. No data until 1965. Number of actual observations by date: 50.
Source name:
World Development Indicators
Source organization:
IEA Statistics © OECD/IEA 2014 (http://www.iea.org/stats/index.asp), subject to https://www.iea.org/t&c/termsandconditions/
Categories, topics:
Energy & Mining
Last updated:
apr 23, 2017
Indicators value changes by year
Maximum:
19.158
jan 1, 2015
At the date of observation
Value
Absolute change
Change from previous value
jan 1, 1966
0.045
+0.045
0.0%
jan 1, 1967
0.058
+0.014
31.0%
jan 1, 1968
0.047
-0.012
-19.86%
jan 1, 1969
0.05
+0.003
5.9%
jan 1, 1970
0.049
0.0
-0.37%
jan 1, 1971
0.042
-0.007
-14.25%
jan 1, 1972
0.043
+0.001
2.49%
jan 1, 1973
0.048
+0.005
11.56%
jan 1, 1974
0.041
-0.008
-15.61%
jan 1, 1975
0.032
-0.009
-22.54%
jan 1, 1976
0.061
+0.03
93.49%
jan 1, 1977
0.058
-0.003
-5.34%
jan 1, 1978
0.05
-0.008
-14.47%
jan 1, 1979
0.042
-0.008
-16.17%
jan 1, 1980
0.044
+0.003
7.04%
jan 1, 1981
0.034
-0.01
-23.57%
jan 1, 1982
0.051
+0.017
50.92%
jan 1, 1983
0.049
-0.003
-5.33%
jan 1, 1984
2.372
+2.323
4.79K%
jan 1, 1985
3.465
+1.093
46.07%
jan 1, 1986
5.72
+2.255
65.1%
jan 1, 1987
6.573
+0.853
14.91%
jan 1, 1988
9.366
+2.793
42.49%
jan 1, 1989
11.593
+2.227
23.78%
jan 1, 1990
12.058
+0.465
4.01%
jan 1, 1991
12.784
+0.726
6.02%
jan 1, 1992
13.422
+0.637
4.99%
jan 1, 1993
14.879
+1.457
10.86%
jan 1, 1994
14.379
-0.5
-3.36%
jan 1, 1995
15.109
+0.73
5.08%
jan 1, 1996
14.525
-0.584
-3.87%
jan 1, 1997
14.385
-0.139
-0.96%
jan 1, 1998
14.464
+0.079
0.55%
jan 1, 1999
14.601
+0.137
0.95%
jan 1, 2000
14.876
+0.274
1.88%
jan 1, 2001
15.246
+0.37
2.49%
jan 1, 2002
14.844
-0.402
-2.63%
jan 1, 2003
14.667
-0.177
-1.19%
jan 1, 2004
11.435
-3.232
-22.04%
jan 1, 2005
12.375
+0.94
8.22%
jan 1, 2006
13.533
+1.157
9.35%
jan 1, 2007
13.283
-0.249
-1.84%
jan 1, 2008
14.792
+1.509
11.36%
jan 1, 2009
15.152
+0.359
2.43%
jan 1, 2010
16.817
+1.665
10.99%
jan 1, 2011
16.686
-0.131
-0.78%
jan 1, 2012
17.151
+0.465
2.79%
jan 1, 2013
18.38
+1.229
7.17%
jan 1, 2014
18.813
+0.433
2.35%
jan 1, 2015
19.158
+0.345
1.83%
Ranking of countries by current statistics by years


Comments: