29
/
en
AIzaSyAYiBZKx7MnpbEhh9jyipgxe19OcubqV5w
April 1, 2024
31312
Europe & Central Asia (excluding high income)
ECA
false
2
1
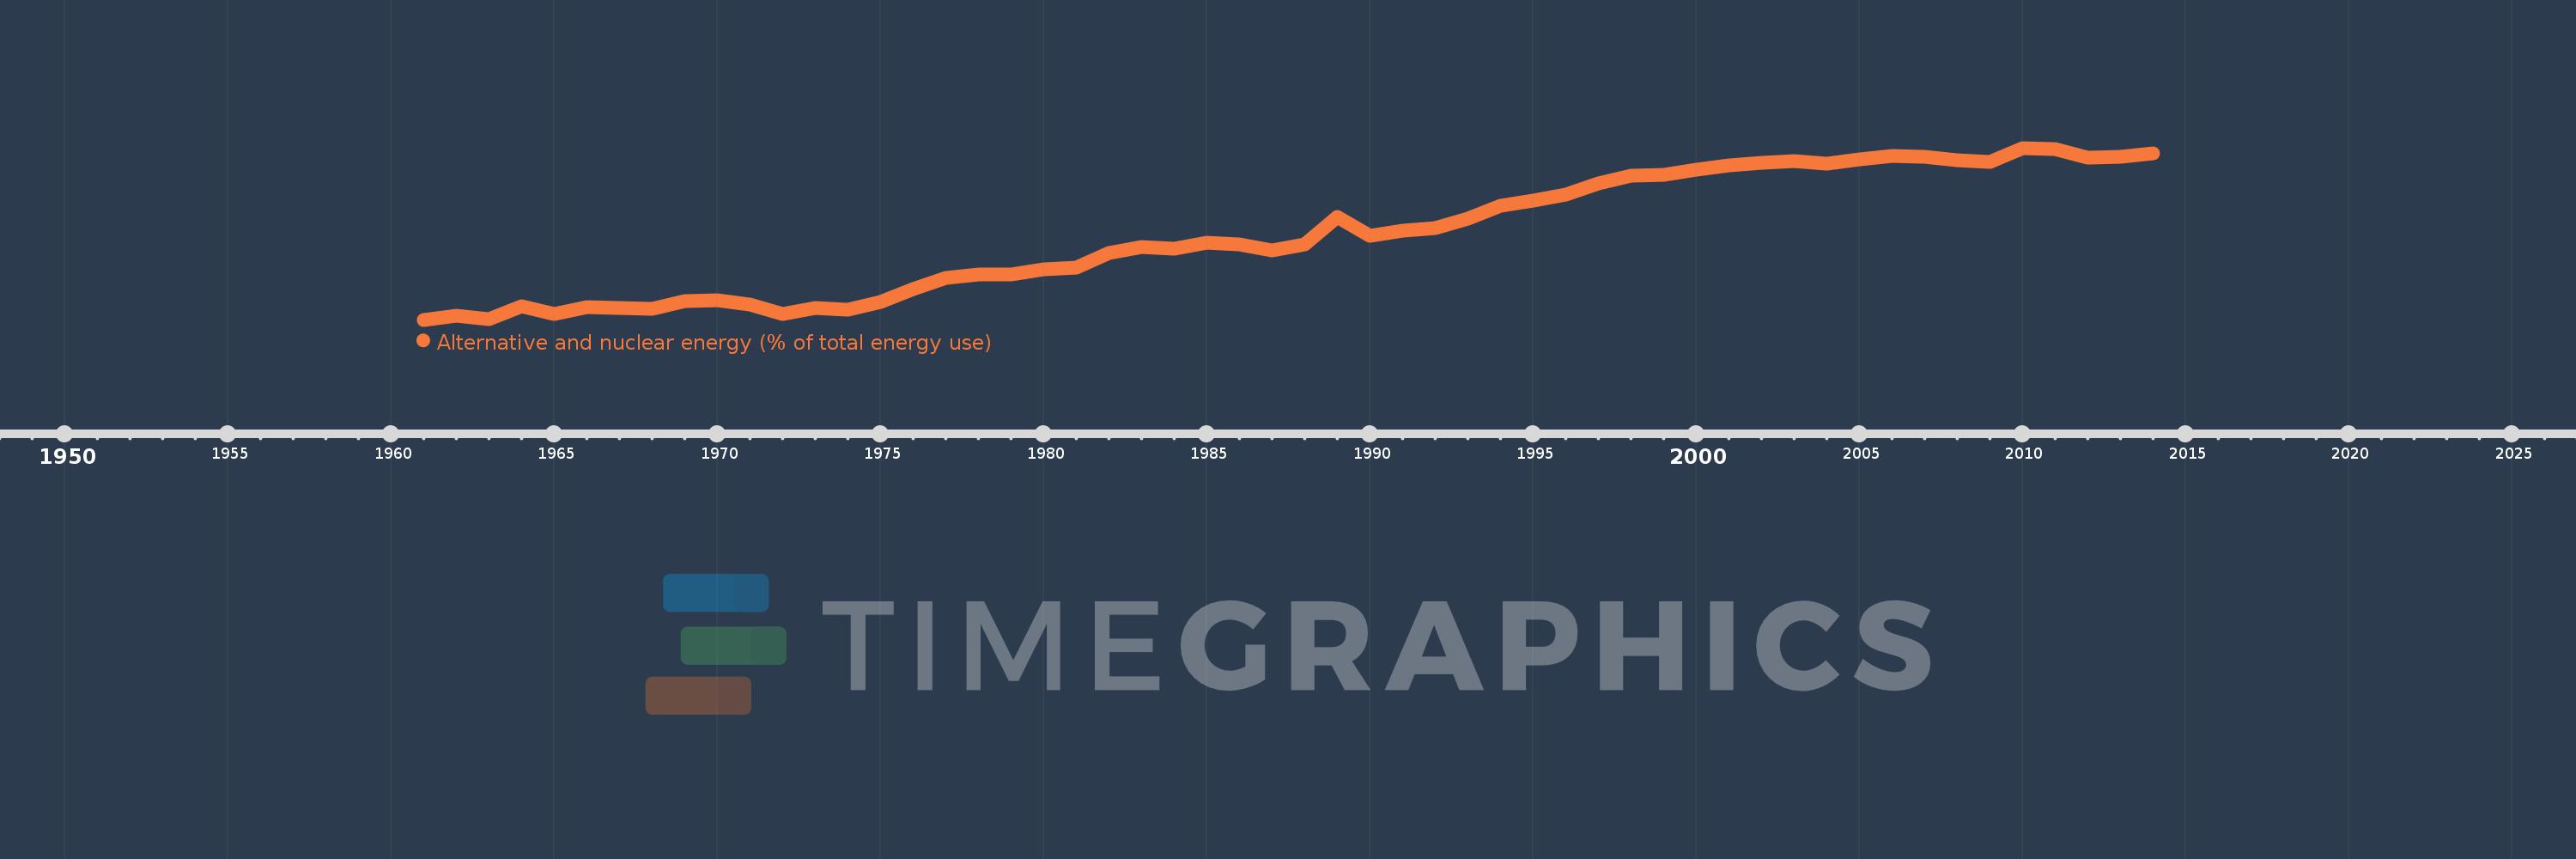
Alternative and nuclear energy (% of total energy use)
2014,2013,2012,2011,2010,2009,2008,2007,2006,2005,2004,2003,2002,2001,2000,1999,1998,1997,1996,1995,1994,1993,1992,1991,1990,1989,1988,1987,1986,1985,1984,1983,1982,1981,1980,1979,1978,1977,1976,1975,1974,1973,1972,1971,1970,1969,1968,1967,1966,1965,1964,1963,1962,1961
This statistics in other country:
AlbaniaAlgeriaAngolaArab WorldArgentinaArmeniaAustraliaAustriaAzerbaijanBahrainBangladeshBelarusBelgiumBeninBoliviaBosnia and HerzegovinaBotswanaBrazilBrunei DarussalamBulgariaCambodiaCameroonCanadaCaribbean small statesCentral Europe and the BalticsChileChinaColombiaCongo, Dem. Rep.Congo, Rep.Costa RicaCote d'IvoireCroatiaCubaCuracaoCyprusCzech RepublicDenmarkDominican RepublicEarly-demographic dividendEast Asia & PacificEast Asia & Pacific (excluding high income)East Asia & Pacific (IDA & IBRD countries)EcuadorEgypt, Arab Rep.El SalvadorEritreaEstoniaEthiopiaEuro areaEurope & Central AsiaEurope & Central Asia (excluding high income)Europe & Central Asia (IDA & IBRD countries)European UnionFinlandFragile and conflict affected situationsFranceGabonGeorgiaGermanyGhanaGibraltarGreeceGuatemalaHaitiHeavily indebted poor countries (HIPC)High incomeHondurasHong Kong SAR, ChinaHungaryIBRD onlyIcelandIDA & IBRD totalIDA blendIDA onlyIDA totalIndiaIndonesiaIran, Islamic Rep.IraqIrelandIsraelItalyJamaicaJapanJordanKazakhstanKenyaKorea, Dem. People’s Rep.Korea, Rep.KosovoKuwaitKyrgyz RepublicLate-demographic dividendLatin America & Caribbean Latin America & Caribbean (excluding high income)Latin America & the Caribbean (IDA & IBRD countries)LatviaLeast developed countries: UN classificationLebanonLibyaLithuaniaLow & middle incomeLow incomeLower middle incomeLuxembourgMacedonia, FYRMalaysiaMaltaMauritiusMexicoMiddle East & North AfricaMiddle East & North Africa (excluding high income)Middle East & North Africa (IDA & IBRD countries)Middle incomeMoldovaMongoliaMontenegroMoroccoMozambiqueMyanmarNamibiaNepalNetherlandsNew ZealandNicaraguaNigerNigeriaNorth AmericaNorwayOECD membersOmanOther small statesPakistanPanamaParaguayPeruPhilippinesPolandPortugalPost-demographic dividendPre-demographic dividendQatarRomaniaRussian FederationSaudi ArabiaSenegalSerbiaSingaporeSlovak RepublicSloveniaSmall statesSouth AfricaSouth AsiaSouth Asia (IDA & IBRD)South SudanSpainSri LankaSub-Saharan Africa Sub-Saharan Africa (excluding high income)Sub-Saharan Africa (IDA & IBRD countries)SudanSwedenSwitzerlandSyrian Arab RepublicTajikistanTanzaniaThailandTogoTrinidad and TobagoTunisiaTurkeyTurkmenistanUkraineUnited Arab EmiratesUnited KingdomUnited StatesUpper middle incomeUruguayUzbekistanVenezuela, RBVietnamWorldYemen, Rep.ZambiaZimbabwe Timeline:
This timeline shows a graph from 1961 to 2014 of Europe & Central Asia (excluding high income). No data until 1960. Number of actual observations by date: 54.
Source name:
World Development Indicators
Source organization:
IEA Statistics © OECD/IEA 2014 (http://www.iea.org/stats/index.asp), subject to https://www.iea.org/t&c/termsandconditions/
Categories, topics:
Energy & Mining
Last updated:
apr 23, 2017
Indicators value changes by year
At the date of observation
Value
Absolute change
Change from previous value
jan 1, 1961
0.806
+0.806
0.0%
jan 1, 1962
1.003
+0.197
24.39%
jan 1, 1963
0.815
-0.187
-18.67%
jan 1, 1964
1.481
+0.665
81.57%
jan 1, 1965
1.106
-0.375
-25.32%
jan 1, 1966
1.409
+0.303
27.44%
jan 1, 1967
1.373
-0.036
-2.56%
jan 1, 1968
1.349
-0.024
-1.74%
jan 1, 1969
1.704
+0.355
26.27%
jan 1, 1970
1.75
+0.046
2.68%
jan 1, 1971
1.556
-0.194
-11.07%
jan 1, 1972
1.087
-0.469
-30.15%
jan 1, 1973
1.375
+0.288
26.52%
jan 1, 1974
1.312
-0.063
-4.57%
jan 1, 1975
1.659
+0.347
26.41%
jan 1, 1976
2.296
+0.637
38.39%
jan 1, 1977
2.862
+0.566
24.65%
jan 1, 1978
3.027
+0.165
5.77%
jan 1, 1979
3.001
-0.025
-0.84%
jan 1, 1980
3.253
+0.252
8.4%
jan 1, 1981
3.358
+0.105
3.22%
jan 1, 1982
4.072
+0.714
21.26%
jan 1, 1983
4.325
+0.253
6.22%
jan 1, 1984
4.265
-0.061
-1.4%
jan 1, 1985
4.558
+0.293
6.88%
jan 1, 1986
4.479
-0.079
-1.73%
jan 1, 1987
4.194
-0.285
-6.37%
jan 1, 1988
4.468
+0.273
6.52%
jan 1, 1989
5.826
+1.359
30.42%
jan 1, 1990
4.898
-0.928
-15.93%
jan 1, 1991
5.122
+0.224
4.56%
jan 1, 1992
5.284
+0.162
3.17%
jan 1, 1993
5.742
+0.458
8.67%
jan 1, 1994
6.338
+0.596
10.38%
jan 1, 1995
6.591
+0.253
3.99%
jan 1, 1996
6.881
+0.29
4.39%
jan 1, 1997
7.456
+0.575
8.35%
jan 1, 1998
7.798
+0.343
4.59%
jan 1, 1999
7.84
+0.041
0.53%
jan 1, 2000
8.099
+0.26
3.31%
jan 1, 2001
8.298
+0.198
2.45%
jan 1, 2002
8.449
+0.152
1.83%
jan 1, 2003
8.539
+0.089
1.06%
jan 1, 2004
8.396
-0.142
-1.67%
jan 1, 2005
8.626
+0.229
2.73%
jan 1, 2006
8.786
+0.16
1.86%
jan 1, 2007
8.714
-0.072
-0.82%
jan 1, 2008
8.557
-0.157
-1.81%
jan 1, 2009
8.472
-0.085
-0.99%
jan 1, 2010
9.164
+0.692
8.17%
jan 1, 2011
9.119
-0.046
-0.5%
jan 1, 2012
8.7
-0.419
-4.59%
jan 1, 2013
8.731
+0.032
0.37%
jan 1, 2014
8.905
+0.174
1.99%
Ranking of countries by current statistics by years


Comments: