29
/
en
AIzaSyAYiBZKx7MnpbEhh9jyipgxe19OcubqV5w
April 1, 2024
248319
Sri Lanka
LKA
true
2
1
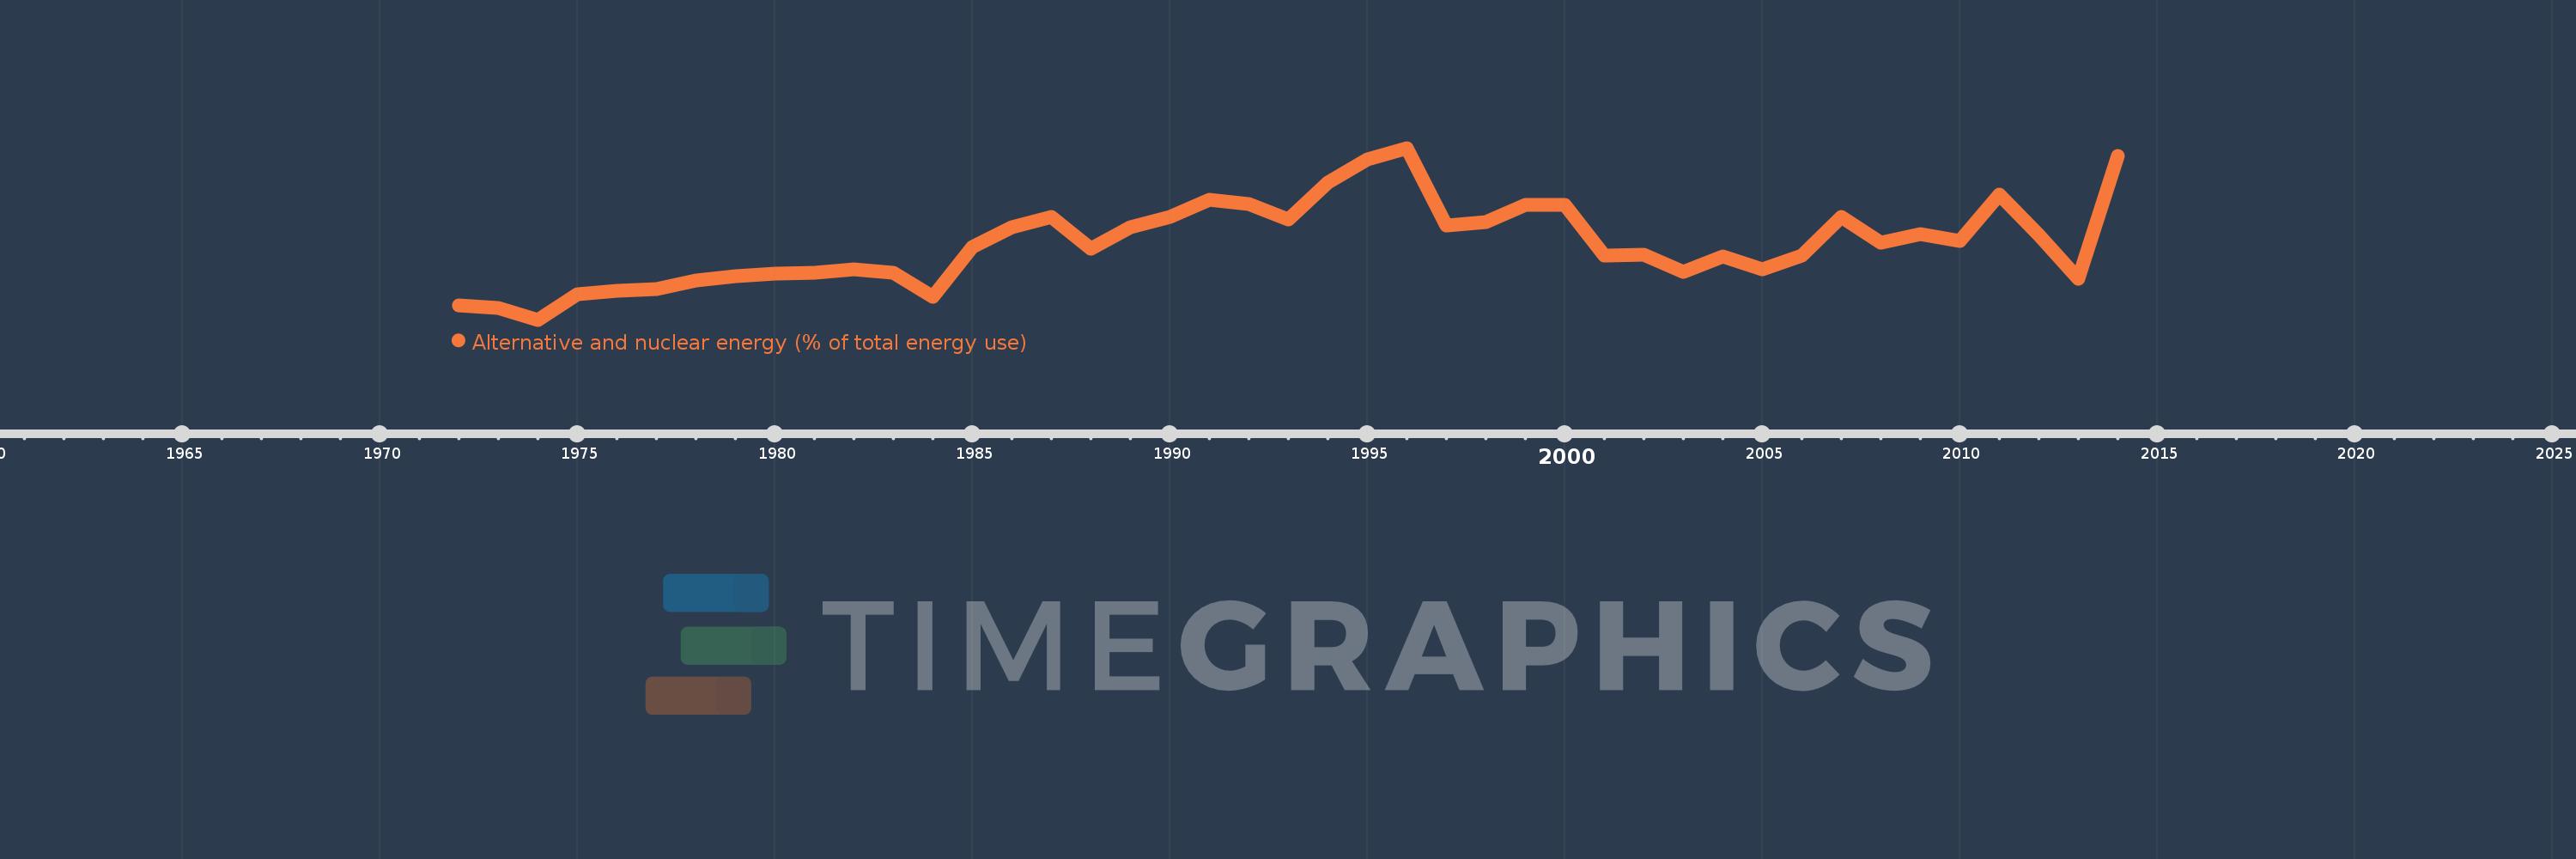
Alternative and nuclear energy (% of total energy use)
2014,2013,2012,2011,2010,2009,2008,2007,2006,2005,2004,2003,2002,2001,2000,1999,1998,1997,1996,1995,1994,1993,1992,1991,1990,1989,1988,1987,1986,1985,1984,1983,1982,1981,1980,1979,1978,1977,1976,1975,1974,1973,1972
This statistics in other country:
AlbaniaAlgeriaAngolaArab WorldArgentinaArmeniaAustraliaAustriaAzerbaijanBahrainBangladeshBelarusBelgiumBeninBoliviaBosnia and HerzegovinaBotswanaBrazilBrunei DarussalamBulgariaCambodiaCameroonCanadaCaribbean small statesCentral Europe and the BalticsChileChinaColombiaCongo, Dem. Rep.Congo, Rep.Costa RicaCote d'IvoireCroatiaCubaCuracaoCyprusCzech RepublicDenmarkDominican RepublicEarly-demographic dividendEast Asia & PacificEast Asia & Pacific (excluding high income)East Asia & Pacific (IDA & IBRD countries)EcuadorEgypt, Arab Rep.El SalvadorEritreaEstoniaEthiopiaEuro areaEurope & Central AsiaEurope & Central Asia (excluding high income)Europe & Central Asia (IDA & IBRD countries)European UnionFinlandFragile and conflict affected situationsFranceGabonGeorgiaGermanyGhanaGibraltarGreeceGuatemalaHaitiHeavily indebted poor countries (HIPC)High incomeHondurasHong Kong SAR, ChinaHungaryIBRD onlyIcelandIDA & IBRD totalIDA blendIDA onlyIDA totalIndiaIndonesiaIran, Islamic Rep.IraqIrelandIsraelItalyJamaicaJapanJordanKazakhstanKenyaKorea, Dem. People’s Rep.Korea, Rep.KosovoKuwaitKyrgyz RepublicLate-demographic dividendLatin America & Caribbean Latin America & Caribbean (excluding high income)Latin America & the Caribbean (IDA & IBRD countries)LatviaLeast developed countries: UN classificationLebanonLibyaLithuaniaLow & middle incomeLow incomeLower middle incomeLuxembourgMacedonia, FYRMalaysiaMaltaMauritiusMexicoMiddle East & North AfricaMiddle East & North Africa (excluding high income)Middle East & North Africa (IDA & IBRD countries)Middle incomeMoldovaMongoliaMontenegroMoroccoMozambiqueMyanmarNamibiaNepalNetherlandsNew ZealandNicaraguaNigerNigeriaNorth AmericaNorwayOECD membersOmanOther small statesPakistanPanamaParaguayPeruPhilippinesPolandPortugalPost-demographic dividendPre-demographic dividendQatarRomaniaRussian FederationSaudi ArabiaSenegalSerbiaSingaporeSlovak RepublicSloveniaSmall statesSouth AfricaSouth AsiaSouth Asia (IDA & IBRD)South SudanSpainSri LankaSub-Saharan Africa Sub-Saharan Africa (excluding high income)Sub-Saharan Africa (IDA & IBRD countries)SudanSwedenSwitzerlandSyrian Arab RepublicTajikistanTanzaniaThailandTogoTrinidad and TobagoTunisiaTurkeyTurkmenistanUkraineUnited Arab EmiratesUnited KingdomUnited StatesUpper middle incomeUruguayUzbekistanVenezuela, RBVietnamWorldYemen, Rep.ZambiaZimbabwe Timeline:
This timeline shows a graph from 1972 to 2014 of Sri Lanka. No data until 1971. Number of actual observations by date: 43.
Source name:
World Development Indicators
Source organization:
IEA Statistics © OECD/IEA 2014 (http://www.iea.org/stats/index.asp), subject to https://www.iea.org/t&c/termsandconditions/
Categories, topics:
Energy & Mining
Last updated:
apr 23, 2017
Indicators value changes by year
At the date of observation
Value
Absolute change
Change from previous value
jan 1, 1972
1.889
+1.889
0.0%
jan 1, 1973
1.82
-0.069
-3.64%
jan 1, 1974
1.473
-0.347
-19.06%
jan 1, 1975
2.192
+0.719
48.8%
jan 1, 1976
2.307
+0.115
5.23%
jan 1, 1977
2.358
+0.051
2.22%
jan 1, 1978
2.603
+0.245
10.41%
jan 1, 1979
2.719
+0.116
4.45%
jan 1, 1980
2.801
+0.082
3.02%
jan 1, 1981
2.805
+0.004
0.15%
jan 1, 1982
2.923
+0.118
4.21%
jan 1, 1983
2.826
-0.097
-3.31%
jan 1, 1984
2.128
-0.698
-24.7%
jan 1, 1985
3.55
+1.421
66.79%
jan 1, 1986
4.123
+0.573
16.15%
jan 1, 1987
4.408
+0.284
6.9%
jan 1, 1988
3.493
-0.915
-20.76%
jan 1, 1989
4.107
+0.615
17.61%
jan 1, 1990
4.418
+0.31
7.56%
jan 1, 1991
4.903
+0.485
10.99%
jan 1, 1992
4.786
-0.118
-2.4%
jan 1, 1993
4.341
-0.445
-9.3%
jan 1, 1994
5.389
+1.049
24.16%
jan 1, 1995
6.045
+0.656
12.17%
jan 1, 1996
6.376
+0.33
5.47%
jan 1, 1997
4.162
-2.214
-34.73%
jan 1, 1998
4.257
+0.095
2.28%
jan 1, 1999
4.756
+0.499
11.72%
jan 1, 2000
4.747
-0.009
-0.18%
jan 1, 2001
3.313
-1.434
-30.2%
jan 1, 2002
3.333
+0.02
0.6%
jan 1, 2003
2.839
-0.495
-14.84%
jan 1, 2004
3.279
+0.44
15.5%
jan 1, 2005
2.909
-0.37
-11.28%
jan 1, 2006
3.313
+0.404
13.88%
jan 1, 2007
4.404
+1.091
32.94%
jan 1, 2008
3.682
-0.722
-16.39%
jan 1, 2009
3.914
+0.232
6.29%
jan 1, 2010
3.709
-0.205
-5.24%
jan 1, 2011
5.036
+1.327
35.78%
jan 1, 2012
3.89
-1.146
-22.76%
jan 1, 2013
2.642
-1.247
-32.07%
jan 1, 2014
6.149
+3.506
132.7%
Ranking of countries by current statistics by years


Comments: