29
/
en
AIzaSyAYiBZKx7MnpbEhh9jyipgxe19OcubqV5w
April 1, 2024
133850
France
FRA
true
2
1
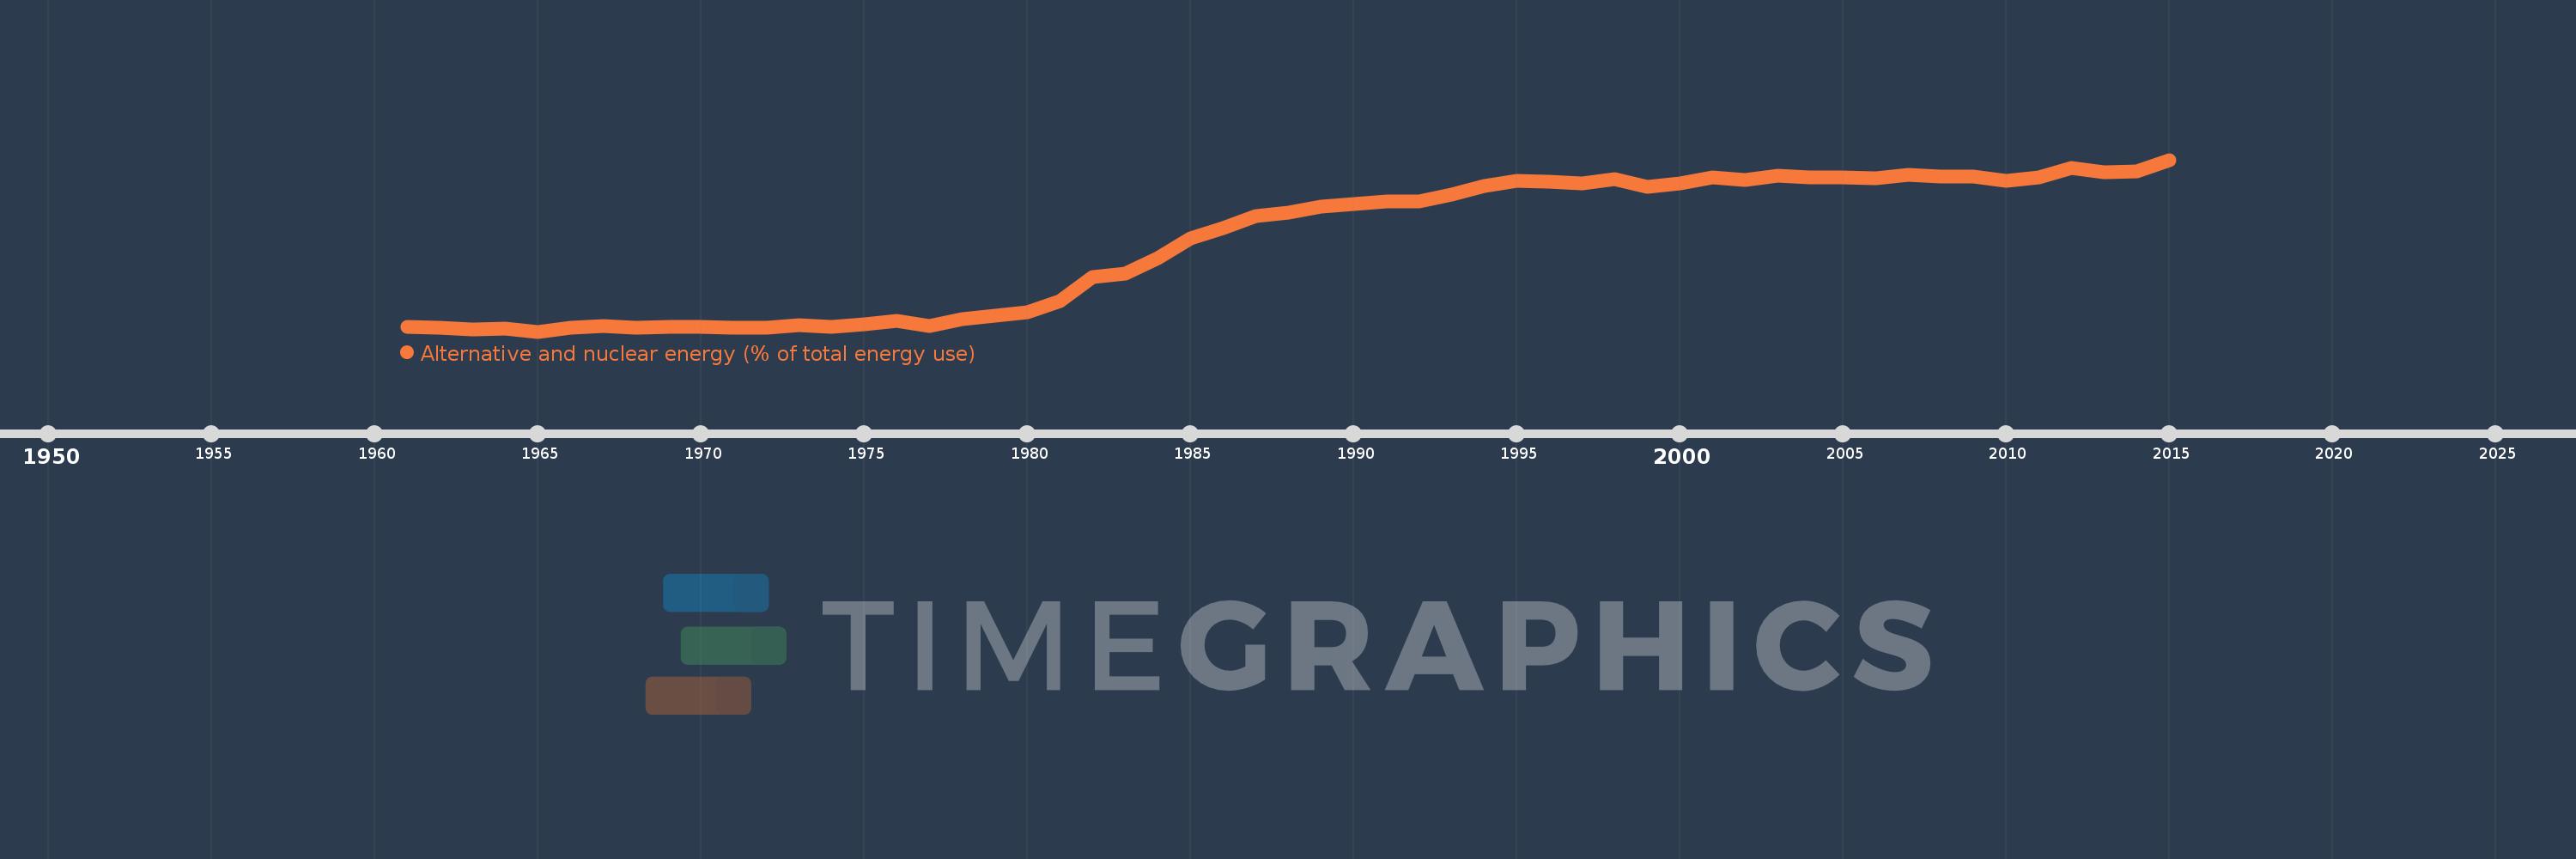
Alternative and nuclear energy (% of total energy use)
2015,2014,2013,2012,2011,2010,2009,2008,2007,2006,2005,2004,2003,2002,2001,2000,1999,1998,1997,1996,1995,1994,1993,1992,1991,1990,1989,1988,1987,1986,1985,1984,1983,1982,1981,1980,1979,1978,1977,1976,1975,1974,1973,1972,1971,1970,1969,1968,1967,1966,1965,1964,1963,1962,1961
This statistics in other country:
AlbaniaAlgeriaAngolaArab WorldArgentinaArmeniaAustraliaAustriaAzerbaijanBahrainBangladeshBelarusBelgiumBeninBoliviaBosnia and HerzegovinaBotswanaBrazilBrunei DarussalamBulgariaCambodiaCameroonCanadaCaribbean small statesCentral Europe and the BalticsChileChinaColombiaCongo, Dem. Rep.Congo, Rep.Costa RicaCote d'IvoireCroatiaCubaCuracaoCyprusCzech RepublicDenmarkDominican RepublicEarly-demographic dividendEast Asia & PacificEast Asia & Pacific (excluding high income)East Asia & Pacific (IDA & IBRD countries)EcuadorEgypt, Arab Rep.El SalvadorEritreaEstoniaEthiopiaEuro areaEurope & Central AsiaEurope & Central Asia (excluding high income)Europe & Central Asia (IDA & IBRD countries)European UnionFinlandFragile and conflict affected situationsFranceGabonGeorgiaGermanyGhanaGibraltarGreeceGuatemalaHaitiHeavily indebted poor countries (HIPC)High incomeHondurasHong Kong SAR, ChinaHungaryIBRD onlyIcelandIDA & IBRD totalIDA blendIDA onlyIDA totalIndiaIndonesiaIran, Islamic Rep.IraqIrelandIsraelItalyJamaicaJapanJordanKazakhstanKenyaKorea, Dem. People’s Rep.Korea, Rep.KosovoKuwaitKyrgyz RepublicLate-demographic dividendLatin America & Caribbean Latin America & Caribbean (excluding high income)Latin America & the Caribbean (IDA & IBRD countries)LatviaLeast developed countries: UN classificationLebanonLibyaLithuaniaLow & middle incomeLow incomeLower middle incomeLuxembourgMacedonia, FYRMalaysiaMaltaMauritiusMexicoMiddle East & North AfricaMiddle East & North Africa (excluding high income)Middle East & North Africa (IDA & IBRD countries)Middle incomeMoldovaMongoliaMontenegroMoroccoMozambiqueMyanmarNamibiaNepalNetherlandsNew ZealandNicaraguaNigerNigeriaNorth AmericaNorwayOECD membersOmanOther small statesPakistanPanamaParaguayPeruPhilippinesPolandPortugalPost-demographic dividendPre-demographic dividendQatarRomaniaRussian FederationSaudi ArabiaSenegalSerbiaSingaporeSlovak RepublicSloveniaSmall statesSouth AfricaSouth AsiaSouth Asia (IDA & IBRD)South SudanSpainSri LankaSub-Saharan Africa Sub-Saharan Africa (excluding high income)Sub-Saharan Africa (IDA & IBRD countries)SudanSwedenSwitzerlandSyrian Arab RepublicTajikistanTanzaniaThailandTogoTrinidad and TobagoTunisiaTurkeyTurkmenistanUkraineUnited Arab EmiratesUnited KingdomUnited StatesUpper middle incomeUruguayUzbekistanVenezuela, RBVietnamWorldYemen, Rep.ZambiaZimbabwe Timeline:
This timeline shows a graph from 1961 to 2015 of France. No data until 1960. Number of actual observations by date: 55.
Source name:
World Development Indicators
Source organization:
IEA Statistics © OECD/IEA 2014 (http://www.iea.org/stats/index.asp), subject to https://www.iea.org/t&c/termsandconditions/
Categories, topics:
Energy & Mining
Last updated:
apr 23, 2017
Indicators value changes by year
Maximum:
50.108
jan 1, 2015
At the date of observation
Value
Absolute change
Change from previous value
jan 1, 1961
4.487
+4.487
0.0%
jan 1, 1962
4.124
-0.362
-8.07%
jan 1, 1963
3.636
-0.488
-11.84%
jan 1, 1964
4.054
+0.418
11.49%
jan 1, 1965
3.115
-0.939
-23.15%
jan 1, 1966
4.096
+0.981
31.5%
jan 1, 1967
4.593
+0.497
12.12%
jan 1, 1968
4.101
-0.492
-10.72%
jan 1, 1969
4.384
+0.283
6.9%
jan 1, 1970
4.498
+0.115
2.62%
jan 1, 1971
4.177
-0.322
-7.16%
jan 1, 1972
4.212
+0.035
0.84%
jan 1, 1973
4.809
+0.598
14.19%
jan 1, 1974
4.437
-0.372
-7.74%
jan 1, 1975
5.0
+0.563
12.69%
jan 1, 1976
6.046
+1.046
20.92%
jan 1, 1977
4.73
-1.316
-21.76%
jan 1, 1978
6.537
+1.807
38.2%
jan 1, 1979
7.528
+0.991
15.16%
jan 1, 1980
8.426
+0.898
11.93%
jan 1, 1981
11.473
+3.047
36.16%
jan 1, 1982
18.005
+6.533
56.94%
jan 1, 1983
18.891
+0.886
4.92%
jan 1, 1984
23.28
+4.389
23.23%
jan 1, 1985
28.612
+5.332
22.91%
jan 1, 1986
31.339
+2.727
9.53%
jan 1, 1987
34.675
+3.336
10.65%
jan 1, 1988
35.559
+0.884
2.55%
jan 1, 1989
37.198
+1.638
4.61%
jan 1, 1990
37.923
+0.725
1.95%
jan 1, 1991
38.686
+0.764
2.01%
jan 1, 1992
38.639
-0.047
-0.12%
jan 1, 1993
40.536
+1.897
4.91%
jan 1, 1994
43.004
+2.469
6.09%
jan 1, 1995
44.283
+1.279
2.97%
jan 1, 1996
44.207
-0.076
-0.17%
jan 1, 1997
43.685
-0.522
-1.18%
jan 1, 1998
44.784
+1.099
2.52%
jan 1, 1999
42.68
-2.104
-4.7%
jan 1, 2000
43.762
+1.082
2.54%
jan 1, 2001
45.293
+1.531
3.5%
jan 1, 2002
44.648
-0.644
-1.42%
jan 1, 2003
45.653
+1.005
2.25%
jan 1, 2004
45.228
-0.425
-0.93%
jan 1, 2005
45.294
+0.066
0.15%
jan 1, 2006
45.169
-0.125
-0.28%
jan 1, 2007
45.921
+0.752
1.67%
jan 1, 2008
45.549
-0.372
-0.81%
jan 1, 2009
45.569
+0.02
0.04%
jan 1, 2010
44.415
-1.155
-2.53%
jan 1, 2011
45.192
+0.777
1.75%
jan 1, 2012
47.917
+2.725
6.03%
jan 1, 2013
46.691
-1.226
-2.56%
jan 1, 2014
46.819
+0.128
0.27%
jan 1, 2015
50.108
+3.289
7.03%
Ranking of countries by current statistics by years


Comments: