29
/
en
AIzaSyAYiBZKx7MnpbEhh9jyipgxe19OcubqV5w
April 1, 2024
149974
Honduras
HND
true
2
1
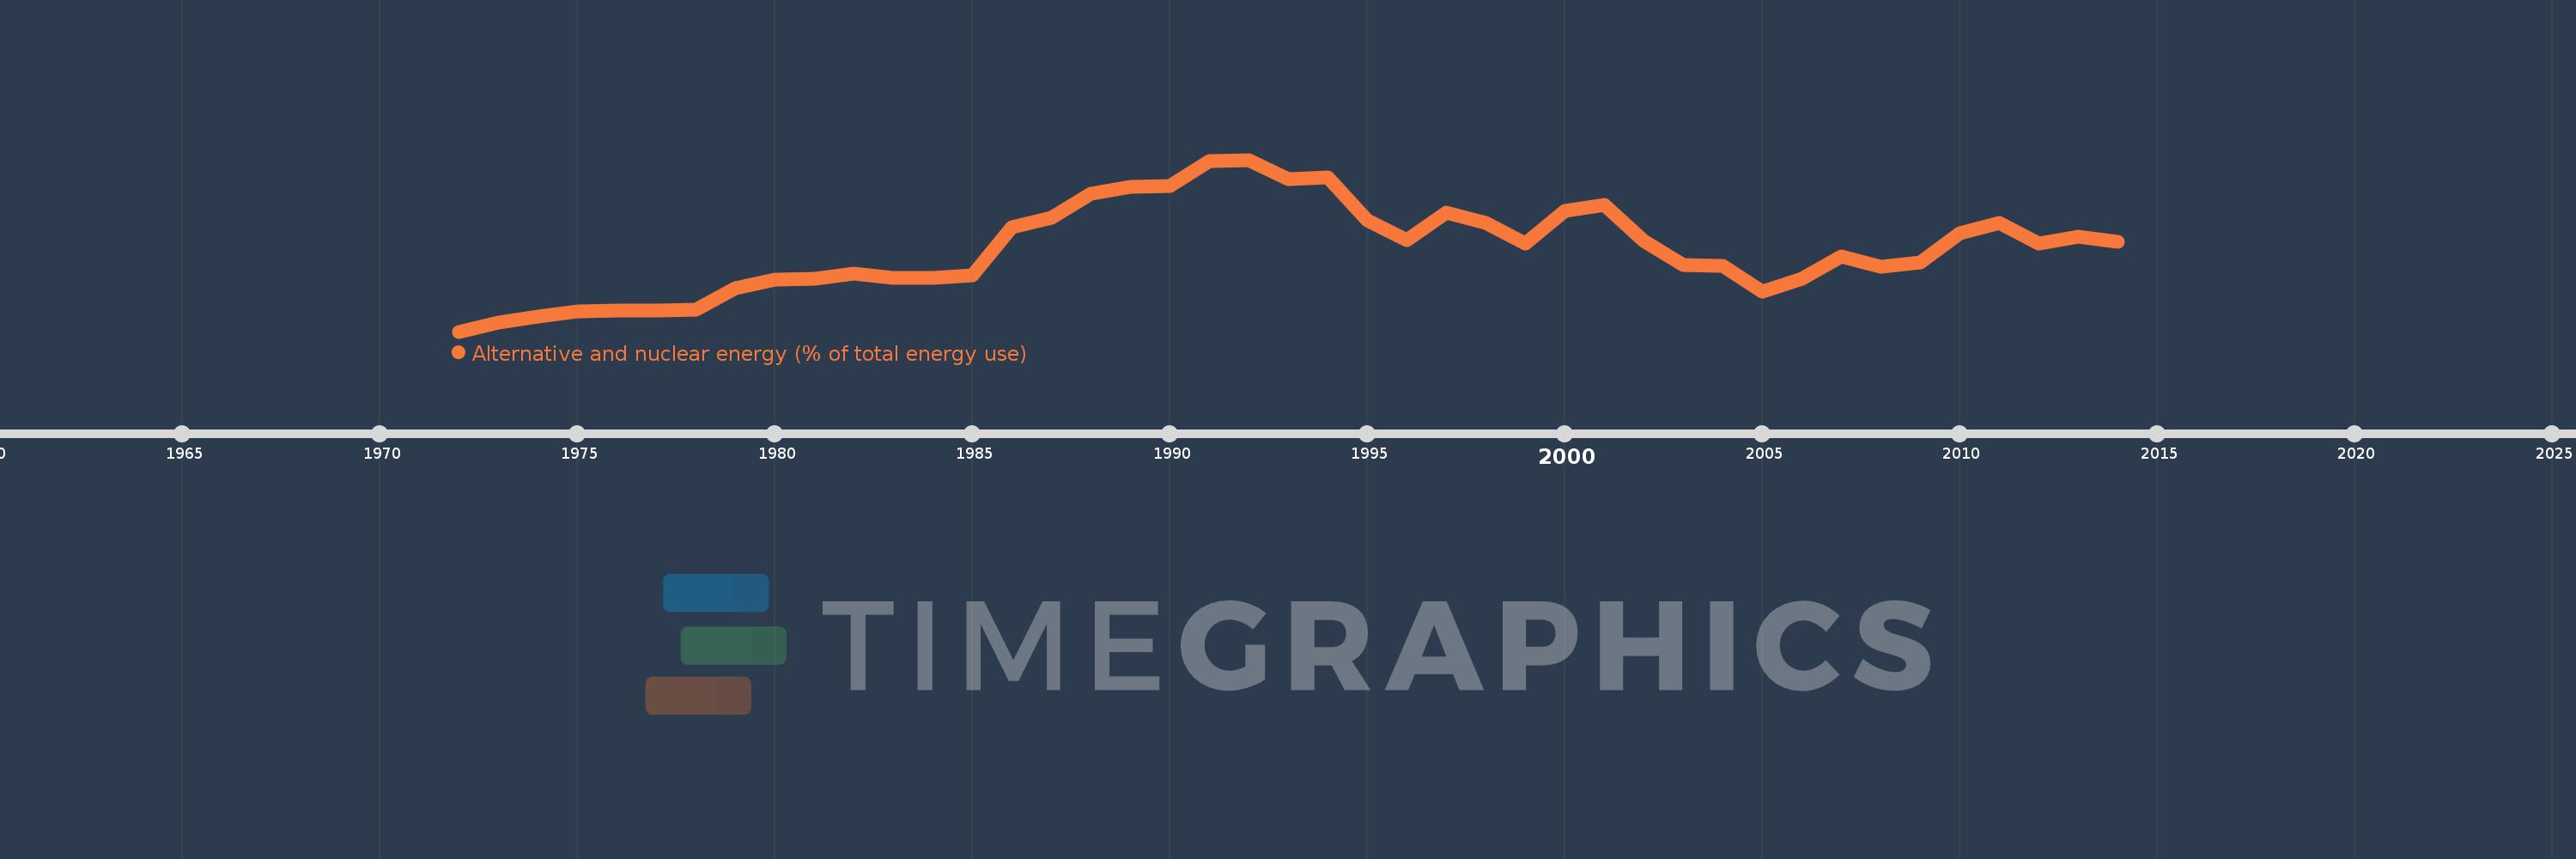
Alternative and nuclear energy (% of total energy use)
2014,2013,2012,2011,2010,2009,2008,2007,2006,2005,2004,2003,2002,2001,2000,1999,1998,1997,1996,1995,1994,1993,1992,1991,1990,1989,1988,1987,1986,1985,1984,1983,1982,1981,1980,1979,1978,1977,1976,1975,1974,1973,1972
This statistics in other country:
AlbaniaAlgeriaAngolaArab WorldArgentinaArmeniaAustraliaAustriaAzerbaijanBahrainBangladeshBelarusBelgiumBeninBoliviaBosnia and HerzegovinaBotswanaBrazilBrunei DarussalamBulgariaCambodiaCameroonCanadaCaribbean small statesCentral Europe and the BalticsChileChinaColombiaCongo, Dem. Rep.Congo, Rep.Costa RicaCote d'IvoireCroatiaCubaCuracaoCyprusCzech RepublicDenmarkDominican RepublicEarly-demographic dividendEast Asia & PacificEast Asia & Pacific (excluding high income)East Asia & Pacific (IDA & IBRD countries)EcuadorEgypt, Arab Rep.El SalvadorEritreaEstoniaEthiopiaEuro areaEurope & Central AsiaEurope & Central Asia (excluding high income)Europe & Central Asia (IDA & IBRD countries)European UnionFinlandFragile and conflict affected situationsFranceGabonGeorgiaGermanyGhanaGibraltarGreeceGuatemalaHaitiHeavily indebted poor countries (HIPC)High incomeHondurasHong Kong SAR, ChinaHungaryIBRD onlyIcelandIDA & IBRD totalIDA blendIDA onlyIDA totalIndiaIndonesiaIran, Islamic Rep.IraqIrelandIsraelItalyJamaicaJapanJordanKazakhstanKenyaKorea, Dem. People’s Rep.Korea, Rep.KosovoKuwaitKyrgyz RepublicLate-demographic dividendLatin America & Caribbean Latin America & Caribbean (excluding high income)Latin America & the Caribbean (IDA & IBRD countries)LatviaLeast developed countries: UN classificationLebanonLibyaLithuaniaLow & middle incomeLow incomeLower middle incomeLuxembourgMacedonia, FYRMalaysiaMaltaMauritiusMexicoMiddle East & North AfricaMiddle East & North Africa (excluding high income)Middle East & North Africa (IDA & IBRD countries)Middle incomeMoldovaMongoliaMontenegroMoroccoMozambiqueMyanmarNamibiaNepalNetherlandsNew ZealandNicaraguaNigerNigeriaNorth AmericaNorwayOECD membersOmanOther small statesPakistanPanamaParaguayPeruPhilippinesPolandPortugalPost-demographic dividendPre-demographic dividendQatarRomaniaRussian FederationSaudi ArabiaSenegalSerbiaSingaporeSlovak RepublicSloveniaSmall statesSouth AfricaSouth AsiaSouth Asia (IDA & IBRD)South SudanSpainSri LankaSub-Saharan Africa Sub-Saharan Africa (excluding high income)Sub-Saharan Africa (IDA & IBRD countries)SudanSwedenSwitzerlandSyrian Arab RepublicTajikistanTanzaniaThailandTogoTrinidad and TobagoTunisiaTurkeyTurkmenistanUkraineUnited Arab EmiratesUnited KingdomUnited StatesUpper middle incomeUruguayUzbekistanVenezuela, RBVietnamWorldYemen, Rep.ZambiaZimbabwe Timeline:
This timeline shows a graph from 1972 to 2014 of Honduras. No data until 1971. Number of actual observations by date: 43.
Source name:
World Development Indicators
Source organization:
IEA Statistics © OECD/IEA 2014 (http://www.iea.org/stats/index.asp), subject to https://www.iea.org/t&c/termsandconditions/
Categories, topics:
Energy & Mining
Last updated:
apr 23, 2017
Indicators value changes by year
At the date of observation
Value
Absolute change
Change from previous value
jan 1, 1972
1.498
+1.498
0.0%
jan 1, 1973
1.84
+0.342
22.84%
jan 1, 1974
2.093
+0.252
13.72%
jan 1, 1975
2.296
+0.203
9.71%
jan 1, 1976
2.346
+0.05
2.16%
jan 1, 1977
2.319
-0.026
-1.12%
jan 1, 1978
2.379
+0.06
2.59%
jan 1, 1979
3.2
+0.821
34.49%
jan 1, 1980
3.545
+0.345
10.78%
jan 1, 1981
3.595
+0.05
1.42%
jan 1, 1982
3.797
+0.201
5.6%
jan 1, 1983
3.614
-0.182
-4.8%
jan 1, 1984
3.621
+0.006
0.17%
jan 1, 1985
3.724
+0.103
2.84%
jan 1, 1986
5.608
+1.885
50.61%
jan 1, 1987
5.981
+0.372
6.64%
jan 1, 1988
6.94
+0.959
16.04%
jan 1, 1989
7.204
+0.264
3.81%
jan 1, 1990
7.26
+0.056
0.78%
jan 1, 1991
8.237
+0.976
13.45%
jan 1, 1992
8.283
+0.047
0.57%
jan 1, 1993
7.53
-0.753
-9.09%
jan 1, 1994
7.589
+0.059
0.79%
jan 1, 1995
5.883
-1.706
-22.48%
jan 1, 1996
5.095
-0.788
-13.4%
jan 1, 1997
6.185
+1.09
21.39%
jan 1, 1998
5.789
-0.395
-6.39%
jan 1, 1999
4.973
-0.816
-14.1%
jan 1, 2000
6.28
+1.307
26.28%
jan 1, 2001
6.498
+0.218
3.47%
jan 1, 2002
5.076
-1.422
-21.88%
jan 1, 2003
4.128
-0.948
-18.68%
jan 1, 2004
4.104
-0.024
-0.58%
jan 1, 2005
3.064
-1.04
-25.34%
jan 1, 2006
3.595
+0.531
17.32%
jan 1, 2007
4.458
+0.863
24.0%
jan 1, 2008
4.06
-0.398
-8.92%
jan 1, 2009
4.236
+0.176
4.33%
jan 1, 2010
5.397
+1.161
27.42%
jan 1, 2011
5.804
+0.406
7.53%
jan 1, 2012
4.983
-0.821
-14.14%
jan 1, 2013
5.244
+0.261
5.24%
jan 1, 2014
5.043
-0.201
-3.84%
Ranking of countries by current statistics by years


Comments: