29
/
en
AIzaSyAYiBZKx7MnpbEhh9jyipgxe19OcubqV5w
April 1, 2024
245222
South Africa
ZAF
true
2
1
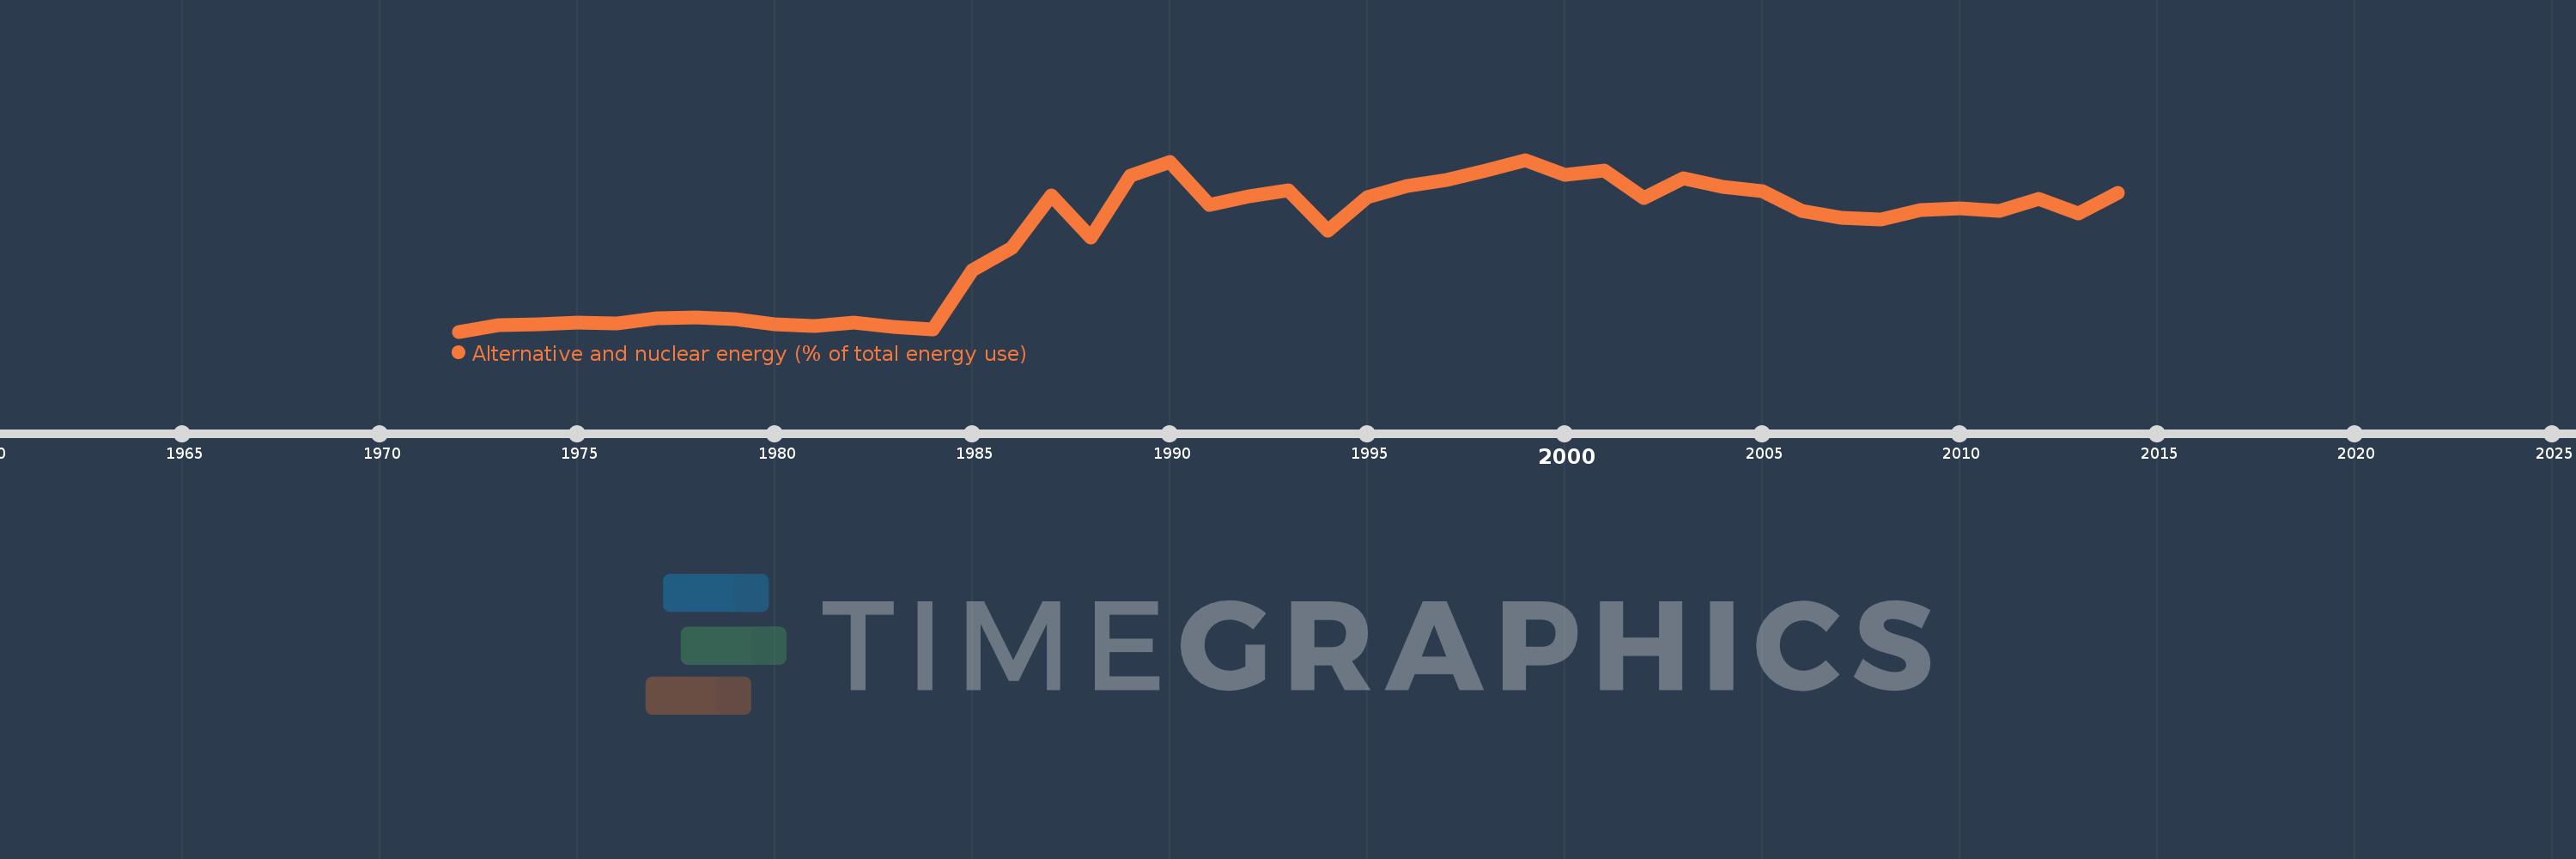
Alternative and nuclear energy (% of total energy use)
2014,2013,2012,2011,2010,2009,2008,2007,2006,2005,2004,2003,2002,2001,2000,1999,1998,1997,1996,1995,1994,1993,1992,1991,1990,1989,1988,1987,1986,1985,1984,1983,1982,1981,1980,1979,1978,1977,1976,1975,1974,1973,1972
This statistics in other country:
AlbaniaAlgeriaAngolaArab WorldArgentinaArmeniaAustraliaAustriaAzerbaijanBahrainBangladeshBelarusBelgiumBeninBoliviaBosnia and HerzegovinaBotswanaBrazilBrunei DarussalamBulgariaCambodiaCameroonCanadaCaribbean small statesCentral Europe and the BalticsChileChinaColombiaCongo, Dem. Rep.Congo, Rep.Costa RicaCote d'IvoireCroatiaCubaCuracaoCyprusCzech RepublicDenmarkDominican RepublicEarly-demographic dividendEast Asia & PacificEast Asia & Pacific (excluding high income)East Asia & Pacific (IDA & IBRD countries)EcuadorEgypt, Arab Rep.El SalvadorEritreaEstoniaEthiopiaEuro areaEurope & Central AsiaEurope & Central Asia (excluding high income)Europe & Central Asia (IDA & IBRD countries)European UnionFinlandFragile and conflict affected situationsFranceGabonGeorgiaGermanyGhanaGibraltarGreeceGuatemalaHaitiHeavily indebted poor countries (HIPC)High incomeHondurasHong Kong SAR, ChinaHungaryIBRD onlyIcelandIDA & IBRD totalIDA blendIDA onlyIDA totalIndiaIndonesiaIran, Islamic Rep.IraqIrelandIsraelItalyJamaicaJapanJordanKazakhstanKenyaKorea, Dem. People’s Rep.Korea, Rep.KosovoKuwaitKyrgyz RepublicLate-demographic dividendLatin America & Caribbean Latin America & Caribbean (excluding high income)Latin America & the Caribbean (IDA & IBRD countries)LatviaLeast developed countries: UN classificationLebanonLibyaLithuaniaLow & middle incomeLow incomeLower middle incomeLuxembourgMacedonia, FYRMalaysiaMaltaMauritiusMexicoMiddle East & North AfricaMiddle East & North Africa (excluding high income)Middle East & North Africa (IDA & IBRD countries)Middle incomeMoldovaMongoliaMontenegroMoroccoMozambiqueMyanmarNamibiaNepalNetherlandsNew ZealandNicaraguaNigerNigeriaNorth AmericaNorwayOECD membersOmanOther small statesPakistanPanamaParaguayPeruPhilippinesPolandPortugalPost-demographic dividendPre-demographic dividendQatarRomaniaRussian FederationSaudi ArabiaSenegalSerbiaSingaporeSlovak RepublicSloveniaSmall statesSouth AfricaSouth AsiaSouth Asia (IDA & IBRD)South SudanSpainSri LankaSub-Saharan Africa Sub-Saharan Africa (excluding high income)Sub-Saharan Africa (IDA & IBRD countries)SudanSwedenSwitzerlandSyrian Arab RepublicTajikistanTanzaniaThailandTogoTrinidad and TobagoTunisiaTurkeyTurkmenistanUkraineUnited Arab EmiratesUnited KingdomUnited StatesUpper middle incomeUruguayUzbekistanVenezuela, RBVietnamWorldYemen, Rep.ZambiaZimbabwe Timeline:
This timeline shows a graph from 1972 to 2014 of South Africa. No data until 1971. Number of actual observations by date: 43.
Source name:
World Development Indicators
Source organization:
IEA Statistics © OECD/IEA 2014 (http://www.iea.org/stats/index.asp), subject to https://www.iea.org/t&c/termsandconditions/
Categories, topics:
Energy & Mining
Last updated:
apr 23, 2017
Indicators value changes by year
At the date of observation
Value
Absolute change
Change from previous value
jan 1, 1972
0.021
+0.021
0.0%
jan 1, 1973
0.155
+0.134
632.3%
jan 1, 1974
0.172
+0.017
10.93%
jan 1, 1975
0.191
+0.019
10.83%
jan 1, 1976
0.178
-0.012
-6.51%
jan 1, 1977
0.289
+0.11
61.91%
jan 1, 1978
0.293
+0.004
1.52%
jan 1, 1979
0.272
-0.021
-7.16%
jan 1, 1980
0.158
-0.114
-41.91%
jan 1, 1981
0.13
-0.028
-17.53%
jan 1, 1982
0.198
+0.067
51.48%
jan 1, 1983
0.112
-0.086
-43.48%
jan 1, 1984
0.064
-0.047
-42.49%
jan 1, 1985
1.24
+1.175
1.83K%
jan 1, 1986
1.665
+0.426
34.35%
jan 1, 1987
2.705
+1.039
62.42%
jan 1, 1988
1.873
-0.832
-30.76%
jan 1, 1989
3.099
+1.226
65.47%
jan 1, 1990
3.369
+0.27
8.7%
jan 1, 1991
2.516
-0.853
-25.31%
jan 1, 1992
2.688
+0.172
6.83%
jan 1, 1993
2.805
+0.117
4.36%
jan 1, 1994
2.005
-0.801
-28.54%
jan 1, 1995
2.668
+0.664
33.1%
jan 1, 1996
2.888
+0.22
8.24%
jan 1, 1997
3.007
+0.119
4.12%
jan 1, 1998
3.198
+0.191
6.36%
jan 1, 1999
3.41
+0.212
6.62%
jan 1, 2000
3.119
-0.291
-8.54%
jan 1, 2001
3.196
+0.077
2.48%
jan 1, 2002
2.654
-0.542
-16.97%
jan 1, 2003
3.039
+0.385
14.51%
jan 1, 2004
2.87
-0.169
-5.57%
jan 1, 2005
2.789
-0.081
-2.81%
jan 1, 2006
2.399
-0.39
-14.0%
jan 1, 2007
2.263
-0.136
-5.67%
jan 1, 2008
2.233
-0.03
-1.31%
jan 1, 2009
2.414
+0.181
8.08%
jan 1, 2010
2.445
+0.031
1.3%
jan 1, 2011
2.401
-0.044
-1.8%
jan 1, 2012
2.643
+0.242
10.07%
jan 1, 2013
2.354
-0.289
-10.94%
jan 1, 2014
2.754
+0.4
17.02%
Ranking of countries by current statistics by years


Comments: