29
/
en
AIzaSyAYiBZKx7MnpbEhh9jyipgxe19OcubqV5w
April 1, 2024
32394
Europe & Central Asia (IDA & IBRD countries)
TEC
false
2
1
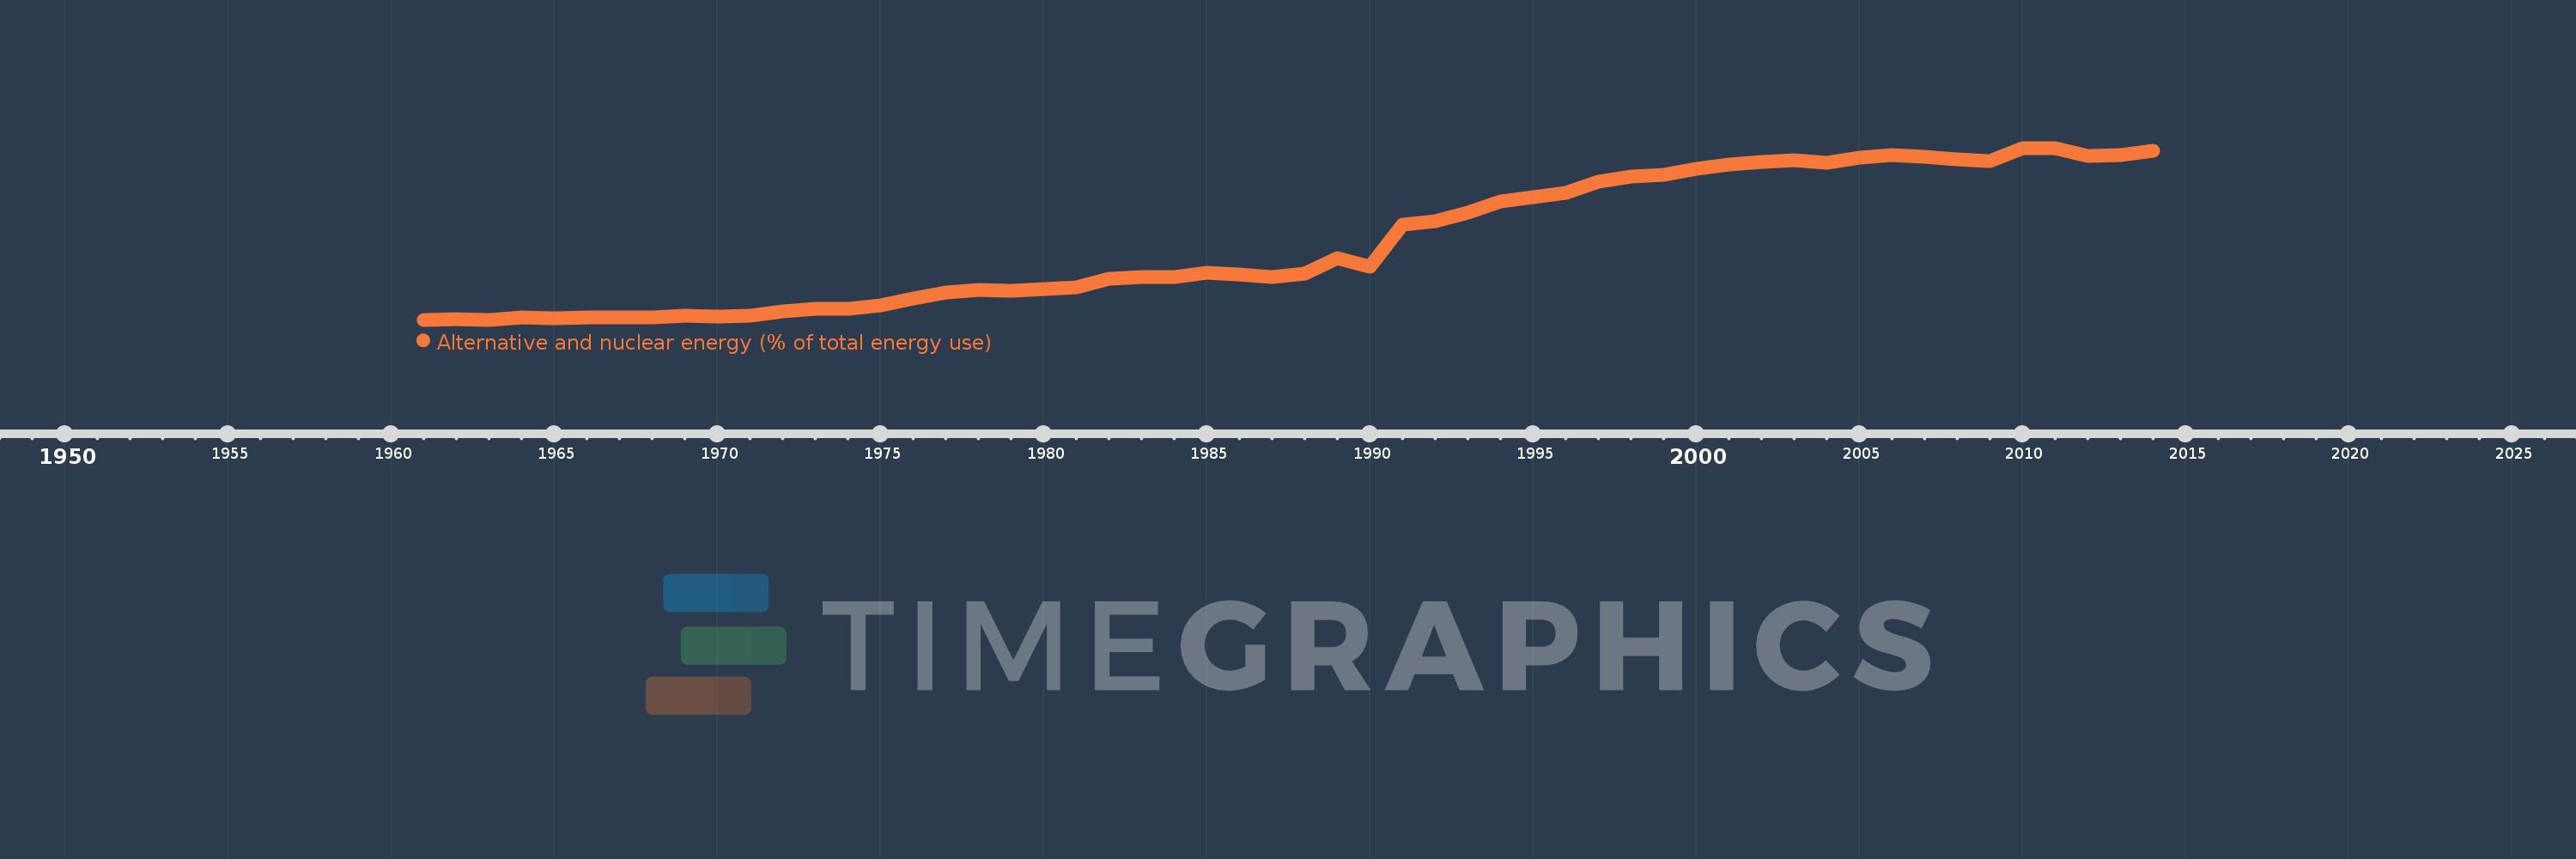
Alternative and nuclear energy (% of total energy use)
2014,2013,2012,2011,2010,2009,2008,2007,2006,2005,2004,2003,2002,2001,2000,1999,1998,1997,1996,1995,1994,1993,1992,1991,1990,1989,1988,1987,1986,1985,1984,1983,1982,1981,1980,1979,1978,1977,1976,1975,1974,1973,1972,1971,1970,1969,1968,1967,1966,1965,1964,1963,1962,1961
This statistics in other country:
AlbaniaAlgeriaAngolaArab WorldArgentinaArmeniaAustraliaAustriaAzerbaijanBahrainBangladeshBelarusBelgiumBeninBoliviaBosnia and HerzegovinaBotswanaBrazilBrunei DarussalamBulgariaCambodiaCameroonCanadaCaribbean small statesCentral Europe and the BalticsChileChinaColombiaCongo, Dem. Rep.Congo, Rep.Costa RicaCote d'IvoireCroatiaCubaCuracaoCyprusCzech RepublicDenmarkDominican RepublicEarly-demographic dividendEast Asia & PacificEast Asia & Pacific (excluding high income)East Asia & Pacific (IDA & IBRD countries)EcuadorEgypt, Arab Rep.El SalvadorEritreaEstoniaEthiopiaEuro areaEurope & Central AsiaEurope & Central Asia (excluding high income)Europe & Central Asia (IDA & IBRD countries)European UnionFinlandFragile and conflict affected situationsFranceGabonGeorgiaGermanyGhanaGibraltarGreeceGuatemalaHaitiHeavily indebted poor countries (HIPC)High incomeHondurasHong Kong SAR, ChinaHungaryIBRD onlyIcelandIDA & IBRD totalIDA blendIDA onlyIDA totalIndiaIndonesiaIran, Islamic Rep.IraqIrelandIsraelItalyJamaicaJapanJordanKazakhstanKenyaKorea, Dem. People’s Rep.Korea, Rep.KosovoKuwaitKyrgyz RepublicLate-demographic dividendLatin America & Caribbean Latin America & Caribbean (excluding high income)Latin America & the Caribbean (IDA & IBRD countries)LatviaLeast developed countries: UN classificationLebanonLibyaLithuaniaLow & middle incomeLow incomeLower middle incomeLuxembourgMacedonia, FYRMalaysiaMaltaMauritiusMexicoMiddle East & North AfricaMiddle East & North Africa (excluding high income)Middle East & North Africa (IDA & IBRD countries)Middle incomeMoldovaMongoliaMontenegroMoroccoMozambiqueMyanmarNamibiaNepalNetherlandsNew ZealandNicaraguaNigerNigeriaNorth AmericaNorwayOECD membersOmanOther small statesPakistanPanamaParaguayPeruPhilippinesPolandPortugalPost-demographic dividendPre-demographic dividendQatarRomaniaRussian FederationSaudi ArabiaSenegalSerbiaSingaporeSlovak RepublicSloveniaSmall statesSouth AfricaSouth AsiaSouth Asia (IDA & IBRD)South SudanSpainSri LankaSub-Saharan Africa Sub-Saharan Africa (excluding high income)Sub-Saharan Africa (IDA & IBRD countries)SudanSwedenSwitzerlandSyrian Arab RepublicTajikistanTanzaniaThailandTogoTrinidad and TobagoTunisiaTurkeyTurkmenistanUkraineUnited Arab EmiratesUnited KingdomUnited StatesUpper middle incomeUruguayUzbekistanVenezuela, RBVietnamWorldYemen, Rep.ZambiaZimbabwe Timeline:
This timeline shows a graph from 1961 to 2014 of Europe & Central Asia (IDA & IBRD countries). No data until 1960. Number of actual observations by date: 54.
Source name:
World Development Indicators
Source organization:
IEA Statistics © OECD/IEA 2014 (http://www.iea.org/stats/index.asp), subject to https://www.iea.org/t&c/termsandconditions/
Categories, topics:
Energy & Mining
Last updated:
apr 23, 2017
Indicators value changes by year
At the date of observation
Value
Absolute change
Change from previous value
jan 1, 1961
0.217
+0.217
0.0%
jan 1, 1962
0.238
+0.021
9.75%
jan 1, 1963
0.225
-0.013
-5.35%
jan 1, 1964
0.327
+0.102
45.32%
jan 1, 1965
0.269
-0.058
-17.62%
jan 1, 1966
0.342
+0.072
26.91%
jan 1, 1967
0.344
+0.002
0.57%
jan 1, 1968
0.342
-0.002
-0.51%
jan 1, 1969
0.407
+0.065
18.89%
jan 1, 1970
0.387
-0.02
-4.87%
jan 1, 1971
0.429
+0.042
10.94%
jan 1, 1972
0.612
+0.182
42.47%
jan 1, 1973
0.755
+0.143
23.39%
jan 1, 1974
0.728
-0.026
-3.46%
jan 1, 1975
0.921
+0.193
26.45%
jan 1, 1976
1.235
+0.314
34.04%
jan 1, 1977
1.515
+0.28
22.71%
jan 1, 1978
1.631
+0.116
7.65%
jan 1, 1979
1.591
-0.04
-2.46%
jan 1, 1980
1.681
+0.09
5.64%
jan 1, 1981
1.768
+0.088
5.21%
jan 1, 1982
2.203
+0.435
24.58%
jan 1, 1983
2.275
+0.072
3.26%
jan 1, 1984
2.283
+0.009
0.38%
jan 1, 1985
2.476
+0.193
8.45%
jan 1, 1986
2.411
-0.065
-2.64%
jan 1, 1987
2.247
-0.164
-6.8%
jan 1, 1988
2.416
+0.169
7.54%
jan 1, 1989
3.165
+0.749
30.98%
jan 1, 1990
2.747
-0.417
-13.19%
jan 1, 1991
4.804
+2.057
74.85%
jan 1, 1992
4.968
+0.165
3.42%
jan 1, 1993
5.369
+0.4
8.05%
jan 1, 1994
5.884
+0.515
9.59%
jan 1, 1995
6.089
+0.206
3.5%
jan 1, 1996
6.33
+0.241
3.95%
jan 1, 1997
6.835
+0.505
7.98%
jan 1, 1998
7.114
+0.279
4.08%
jan 1, 1999
7.187
+0.072
1.02%
jan 1, 2000
7.45
+0.264
3.67%
jan 1, 2001
7.663
+0.213
2.86%
jan 1, 2002
7.806
+0.142
1.86%
jan 1, 2003
7.89
+0.085
1.09%
jan 1, 2004
7.757
-0.133
-1.69%
jan 1, 2005
7.992
+0.234
3.02%
jan 1, 2006
8.131
+0.139
1.74%
jan 1, 2007
8.053
-0.078
-0.95%
jan 1, 2008
7.91
-0.143
-1.78%
jan 1, 2009
7.841
-0.069
-0.87%
jan 1, 2010
8.469
+0.628
8.01%
jan 1, 2011
8.447
-0.022
-0.26%
jan 1, 2012
8.069
-0.378
-4.48%
jan 1, 2013
8.138
+0.069
0.86%
jan 1, 2014
8.325
+0.186
2.29%
Ranking of countries by current statistics by years


Comments: