29
/
en
AIzaSyAYiBZKx7MnpbEhh9jyipgxe19OcubqV5w
April 1, 2024
47925
Middle East & North Africa
MEA
false
2
1
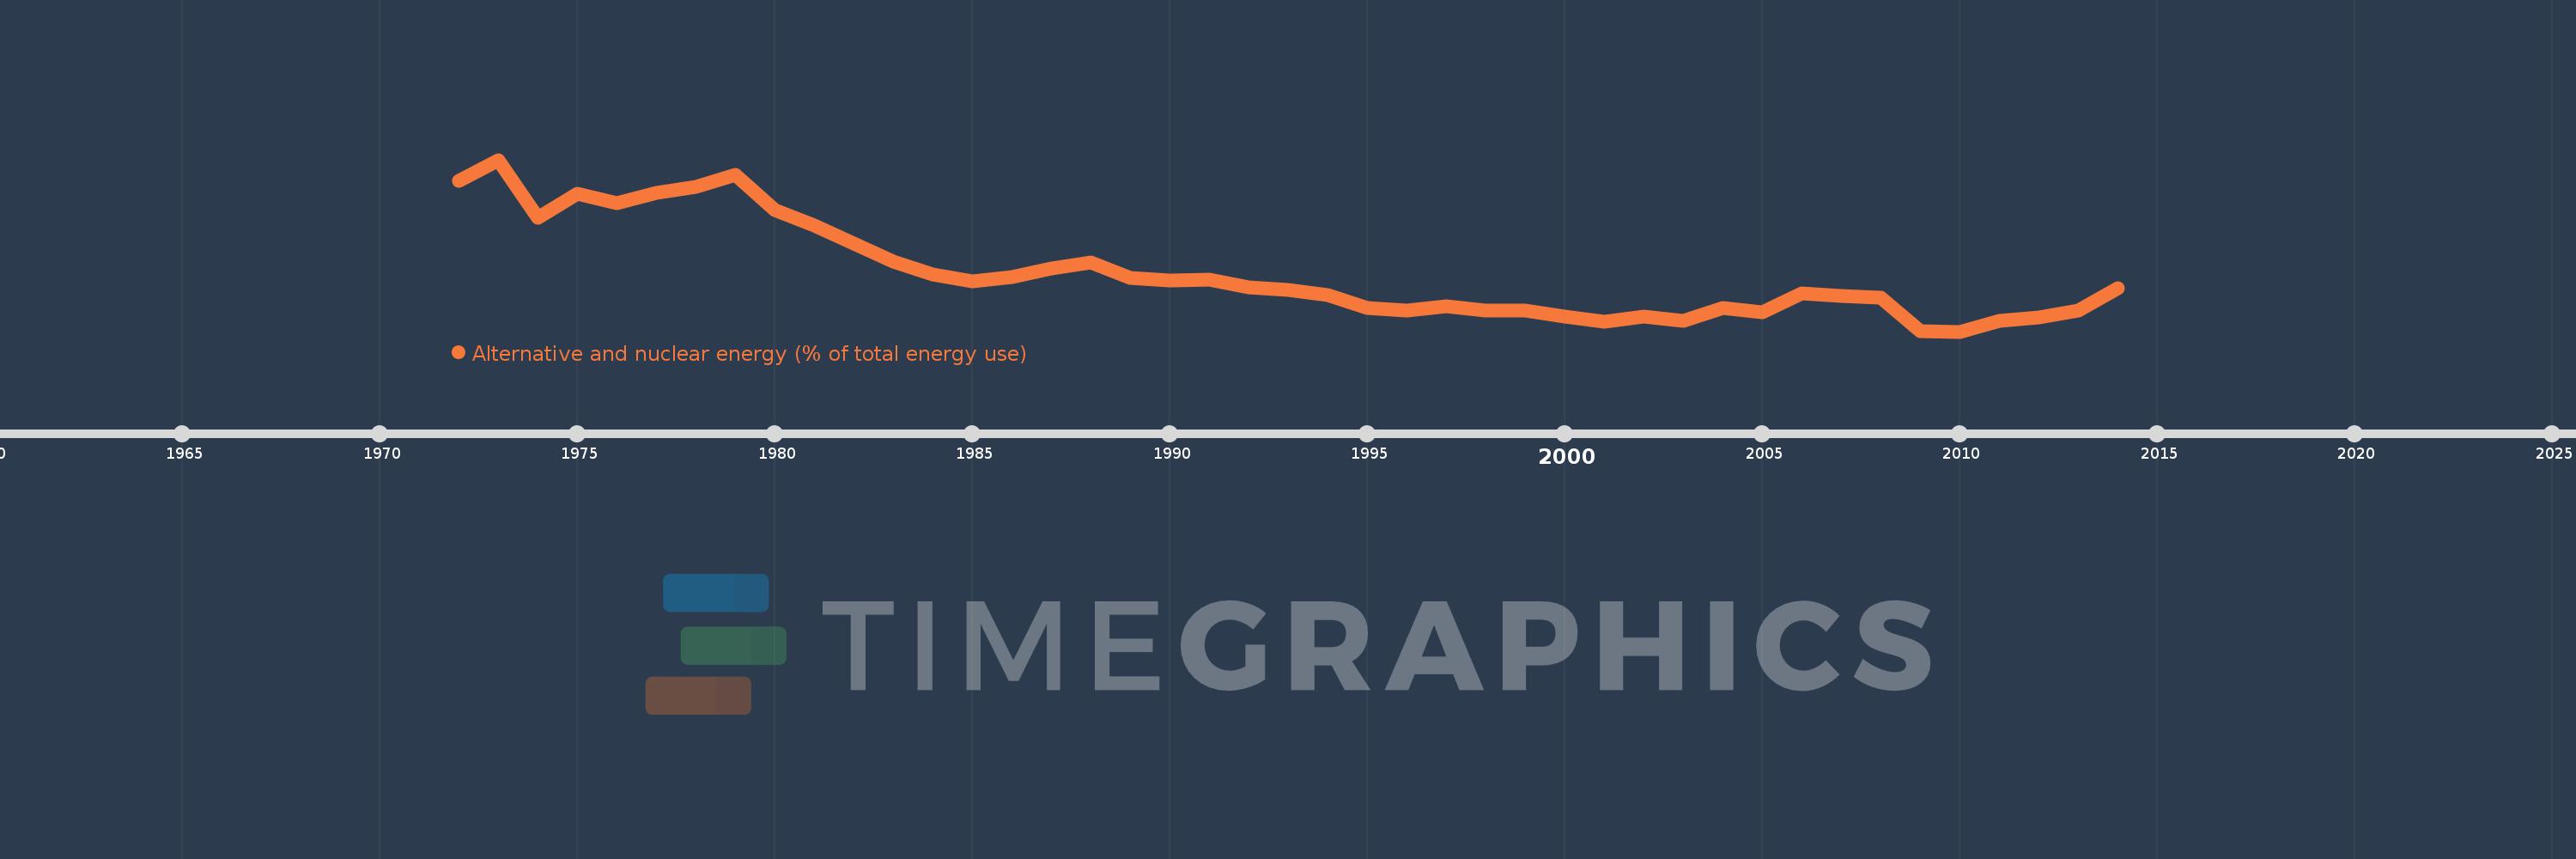
Alternative and nuclear energy (% of total energy use)
2014,2013,2012,2011,2010,2009,2008,2007,2006,2005,2004,2003,2002,2001,2000,1999,1998,1997,1996,1995,1994,1993,1992,1991,1990,1989,1988,1987,1986,1985,1984,1983,1982,1981,1980,1979,1978,1977,1976,1975,1974,1973,1972
This statistics in other country:
AlbaniaAlgeriaAngolaArab WorldArgentinaArmeniaAustraliaAustriaAzerbaijanBahrainBangladeshBelarusBelgiumBeninBoliviaBosnia and HerzegovinaBotswanaBrazilBrunei DarussalamBulgariaCambodiaCameroonCanadaCaribbean small statesCentral Europe and the BalticsChileChinaColombiaCongo, Dem. Rep.Congo, Rep.Costa RicaCote d'IvoireCroatiaCubaCuracaoCyprusCzech RepublicDenmarkDominican RepublicEarly-demographic dividendEast Asia & PacificEast Asia & Pacific (excluding high income)East Asia & Pacific (IDA & IBRD countries)EcuadorEgypt, Arab Rep.El SalvadorEritreaEstoniaEthiopiaEuro areaEurope & Central AsiaEurope & Central Asia (excluding high income)Europe & Central Asia (IDA & IBRD countries)European UnionFinlandFragile and conflict affected situationsFranceGabonGeorgiaGermanyGhanaGibraltarGreeceGuatemalaHaitiHeavily indebted poor countries (HIPC)High incomeHondurasHong Kong SAR, ChinaHungaryIBRD onlyIcelandIDA & IBRD totalIDA blendIDA onlyIDA totalIndiaIndonesiaIran, Islamic Rep.IraqIrelandIsraelItalyJamaicaJapanJordanKazakhstanKenyaKorea, Dem. People’s Rep.Korea, Rep.KosovoKuwaitKyrgyz RepublicLate-demographic dividendLatin America & Caribbean Latin America & Caribbean (excluding high income)Latin America & the Caribbean (IDA & IBRD countries)LatviaLeast developed countries: UN classificationLebanonLibyaLithuaniaLow & middle incomeLow incomeLower middle incomeLuxembourgMacedonia, FYRMalaysiaMaltaMauritiusMexicoMiddle East & North AfricaMiddle East & North Africa (excluding high income)Middle East & North Africa (IDA & IBRD countries)Middle incomeMoldovaMongoliaMontenegroMoroccoMozambiqueMyanmarNamibiaNepalNetherlandsNew ZealandNicaraguaNigerNigeriaNorth AmericaNorwayOECD membersOmanOther small statesPakistanPanamaParaguayPeruPhilippinesPolandPortugalPost-demographic dividendPre-demographic dividendQatarRomaniaRussian FederationSaudi ArabiaSenegalSerbiaSingaporeSlovak RepublicSloveniaSmall statesSouth AfricaSouth AsiaSouth Asia (IDA & IBRD)South SudanSpainSri LankaSub-Saharan Africa Sub-Saharan Africa (excluding high income)Sub-Saharan Africa (IDA & IBRD countries)SudanSwedenSwitzerlandSyrian Arab RepublicTajikistanTanzaniaThailandTogoTrinidad and TobagoTunisiaTurkeyTurkmenistanUkraineUnited Arab EmiratesUnited KingdomUnited StatesUpper middle incomeUruguayUzbekistanVenezuela, RBVietnamWorldYemen, Rep.ZambiaZimbabwe Timeline:
This timeline shows a graph from 1972 to 2014 of Middle East & North Africa. No data until 1971. Number of actual observations by date: 43.
Source name:
World Development Indicators
Source organization:
IEA Statistics © OECD/IEA 2014 (http://www.iea.org/stats/index.asp), subject to https://www.iea.org/t&c/termsandconditions/
Categories, topics:
Energy & Mining
Last updated:
apr 23, 2017
Indicators value changes by year
At the date of observation
Value
Absolute change
Change from previous value
jan 1, 1972
1.387
+1.387
0.0%
jan 1, 1973
1.511
+0.123
8.9%
jan 1, 1974
1.169
-0.341
-22.6%
jan 1, 1975
1.308
+0.139
11.88%
jan 1, 1976
1.255
-0.053
-4.08%
jan 1, 1977
1.315
+0.06
4.75%
jan 1, 1978
1.351
+0.036
2.77%
jan 1, 1979
1.422
+0.071
5.24%
jan 1, 1980
1.212
-0.21
-14.75%
jan 1, 1981
1.12
-0.092
-7.58%
jan 1, 1982
1.012
-0.108
-9.66%
jan 1, 1983
0.906
-0.106
-10.48%
jan 1, 1984
0.828
-0.078
-8.63%
jan 1, 1985
0.79
-0.038
-4.6%
jan 1, 1986
0.814
+0.025
3.11%
jan 1, 1987
0.864
+0.05
6.11%
jan 1, 1988
0.901
+0.037
4.24%
jan 1, 1989
0.812
-0.088
-9.81%
jan 1, 1990
0.795
-0.017
-2.13%
jan 1, 1991
0.802
+0.008
0.95%
jan 1, 1992
0.753
-0.049
-6.11%
jan 1, 1993
0.737
-0.017
-2.23%
jan 1, 1994
0.706
-0.031
-4.16%
jan 1, 1995
0.63
-0.076
-10.78%
jan 1, 1996
0.615
-0.014
-2.28%
jan 1, 1997
0.64
+0.024
3.91%
jan 1, 1998
0.617
-0.023
-3.53%
jan 1, 1999
0.617
+0.0
0.04%
jan 1, 2000
0.579
-0.038
-6.21%
jan 1, 2001
0.551
-0.028
-4.9%
jan 1, 2002
0.578
+0.027
4.93%
jan 1, 2003
0.556
-0.022
-3.72%
jan 1, 2004
0.631
+0.075
13.4%
jan 1, 2005
0.607
-0.023
-3.69%
jan 1, 2006
0.716
+0.109
17.95%
jan 1, 2007
0.704
-0.013
-1.77%
jan 1, 2008
0.692
-0.012
-1.71%
jan 1, 2009
0.495
-0.197
-28.48%
jan 1, 2010
0.491
-0.004
-0.72%
jan 1, 2011
0.554
+0.063
12.81%
jan 1, 2012
0.576
+0.022
3.91%
jan 1, 2013
0.615
+0.039
6.75%
jan 1, 2014
0.75
+0.135
22.01%
Ranking of countries by current statistics by years


Comments: