29
/
en
AIzaSyAYiBZKx7MnpbEhh9jyipgxe19OcubqV5w
April 1, 2024
39712
IDA total
IDA
false
2
1
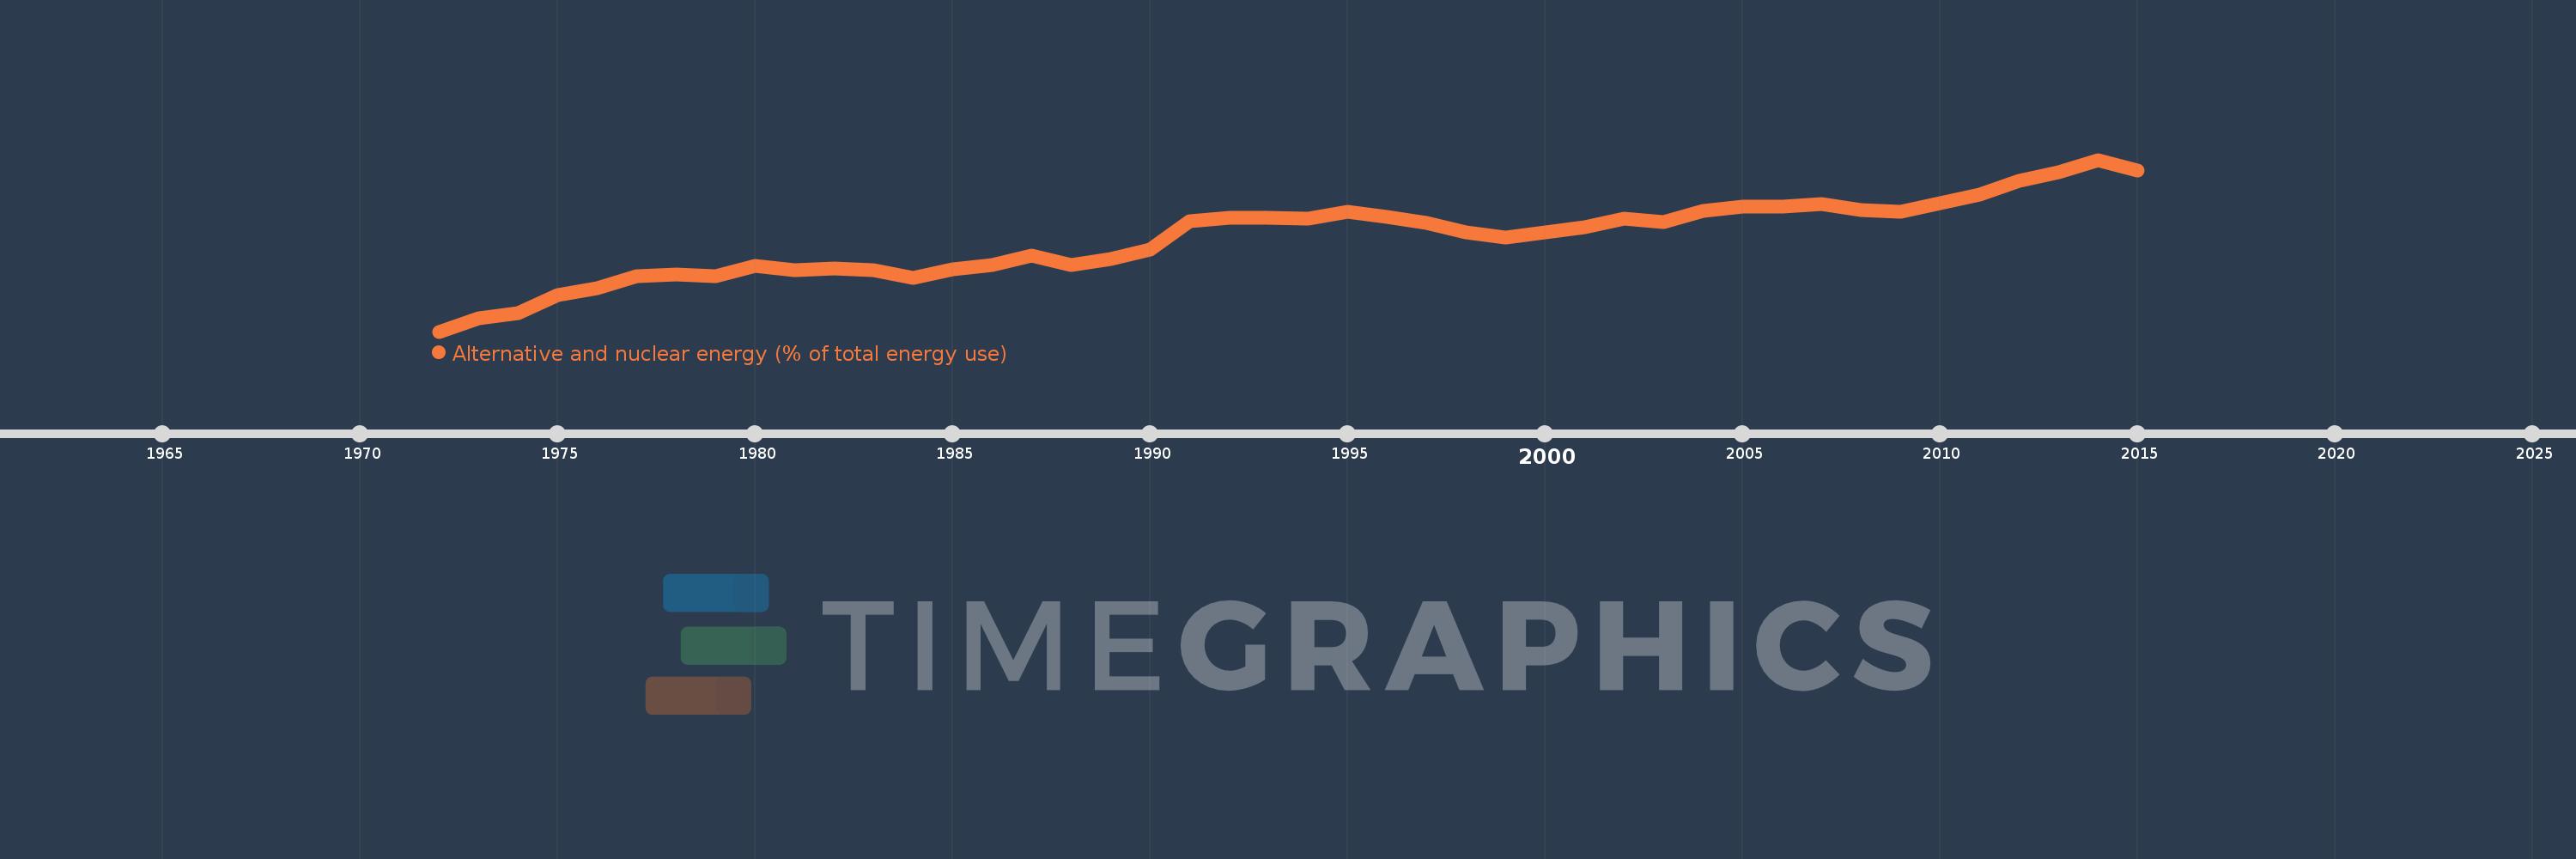
Alternative and nuclear energy (% of total energy use)
2015,2014,2013,2012,2011,2010,2009,2008,2007,2006,2005,2004,2003,2002,2001,2000,1999,1998,1997,1996,1995,1994,1993,1992,1991,1990,1989,1988,1987,1986,1985,1984,1983,1982,1981,1980,1979,1978,1977,1976,1975,1974,1973,1972
This statistics in other country:
AlbaniaAlgeriaAngolaArab WorldArgentinaArmeniaAustraliaAustriaAzerbaijanBahrainBangladeshBelarusBelgiumBeninBoliviaBosnia and HerzegovinaBotswanaBrazilBrunei DarussalamBulgariaCambodiaCameroonCanadaCaribbean small statesCentral Europe and the BalticsChileChinaColombiaCongo, Dem. Rep.Congo, Rep.Costa RicaCote d'IvoireCroatiaCubaCuracaoCyprusCzech RepublicDenmarkDominican RepublicEarly-demographic dividendEast Asia & PacificEast Asia & Pacific (excluding high income)East Asia & Pacific (IDA & IBRD countries)EcuadorEgypt, Arab Rep.El SalvadorEritreaEstoniaEthiopiaEuro areaEurope & Central AsiaEurope & Central Asia (excluding high income)Europe & Central Asia (IDA & IBRD countries)European UnionFinlandFragile and conflict affected situationsFranceGabonGeorgiaGermanyGhanaGibraltarGreeceGuatemalaHaitiHeavily indebted poor countries (HIPC)High incomeHondurasHong Kong SAR, ChinaHungaryIBRD onlyIcelandIDA & IBRD totalIDA blendIDA onlyIDA totalIndiaIndonesiaIran, Islamic Rep.IraqIrelandIsraelItalyJamaicaJapanJordanKazakhstanKenyaKorea, Dem. People’s Rep.Korea, Rep.KosovoKuwaitKyrgyz RepublicLate-demographic dividendLatin America & Caribbean Latin America & Caribbean (excluding high income)Latin America & the Caribbean (IDA & IBRD countries)LatviaLeast developed countries: UN classificationLebanonLibyaLithuaniaLow & middle incomeLow incomeLower middle incomeLuxembourgMacedonia, FYRMalaysiaMaltaMauritiusMexicoMiddle East & North AfricaMiddle East & North Africa (excluding high income)Middle East & North Africa (IDA & IBRD countries)Middle incomeMoldovaMongoliaMontenegroMoroccoMozambiqueMyanmarNamibiaNepalNetherlandsNew ZealandNicaraguaNigerNigeriaNorth AmericaNorwayOECD membersOmanOther small statesPakistanPanamaParaguayPeruPhilippinesPolandPortugalPost-demographic dividendPre-demographic dividendQatarRomaniaRussian FederationSaudi ArabiaSenegalSerbiaSingaporeSlovak RepublicSloveniaSmall statesSouth AfricaSouth AsiaSouth Asia (IDA & IBRD)South SudanSpainSri LankaSub-Saharan Africa Sub-Saharan Africa (excluding high income)Sub-Saharan Africa (IDA & IBRD countries)SudanSwedenSwitzerlandSyrian Arab RepublicTajikistanTanzaniaThailandTogoTrinidad and TobagoTunisiaTurkeyTurkmenistanUkraineUnited Arab EmiratesUnited KingdomUnited StatesUpper middle incomeUruguayUzbekistanVenezuela, RBVietnamWorldYemen, Rep.ZambiaZimbabwe Timeline:
This timeline shows a graph from 1972 to 2015 of IDA total. No data until 1971. Number of actual observations by date: 44.
Source name:
World Development Indicators
Source organization:
IEA Statistics © OECD/IEA 2014 (http://www.iea.org/stats/index.asp), subject to https://www.iea.org/t&c/termsandconditions/
Categories, topics:
Energy & Mining
Last updated:
apr 23, 2017
Indicators value changes by year
At the date of observation
Value
Absolute change
Change from previous value
jan 1, 1972
1.153
+1.153
0.0%
jan 1, 1973
1.346
+0.193
16.73%
jan 1, 1974
1.421
+0.075
5.54%
jan 1, 1975
1.681
+0.26
18.34%
jan 1, 1976
1.783
+0.102
6.06%
jan 1, 1977
1.949
+0.166
9.31%
jan 1, 1978
1.982
+0.033
1.69%
jan 1, 1979
1.956
-0.026
-1.3%
jan 1, 1980
2.102
+0.145
7.44%
jan 1, 1981
2.032
-0.069
-3.3%
jan 1, 1982
2.068
+0.036
1.75%
jan 1, 1983
2.037
-0.031
-1.48%
jan 1, 1984
1.922
-0.116
-5.68%
jan 1, 1985
2.054
+0.133
6.9%
jan 1, 1986
2.113
+0.059
2.87%
jan 1, 1987
2.251
+0.137
6.51%
jan 1, 1988
2.115
-0.136
-6.04%
jan 1, 1989
2.196
+0.081
3.84%
jan 1, 1990
2.34
+0.144
6.55%
jan 1, 1991
2.748
+0.408
17.43%
jan 1, 1992
2.791
+0.044
1.58%
jan 1, 1993
2.795
+0.003
0.12%
jan 1, 1994
2.78
-0.014
-0.5%
jan 1, 1995
2.879
+0.099
3.56%
jan 1, 1996
2.805
-0.074
-2.58%
jan 1, 1997
2.715
-0.09
-3.2%
jan 1, 1998
2.582
-0.133
-4.9%
jan 1, 1999
2.505
-0.077
-3.0%
jan 1, 2000
2.579
+0.075
2.98%
jan 1, 2001
2.651
+0.072
2.77%
jan 1, 2002
2.782
+0.131
4.94%
jan 1, 2003
2.735
-0.047
-1.68%
jan 1, 2004
2.892
+0.157
5.72%
jan 1, 2005
2.949
+0.057
1.98%
jan 1, 2006
2.958
+0.009
0.31%
jan 1, 2007
2.995
+0.037
1.24%
jan 1, 2008
2.902
-0.093
-3.09%
jan 1, 2009
2.876
-0.026
-0.9%
jan 1, 2010
3.005
+0.129
4.47%
jan 1, 2011
3.132
+0.128
4.25%
jan 1, 2012
3.329
+0.197
6.28%
jan 1, 2013
3.454
+0.125
3.75%
jan 1, 2014
3.629
+0.175
5.05%
jan 1, 2015
3.473
-0.156
-4.29%
Ranking of countries by current statistics by years


Comments: