29
/
en
AIzaSyAYiBZKx7MnpbEhh9jyipgxe19OcubqV5w
April 1, 2024
167105
Kenya
KEN
true
2
1
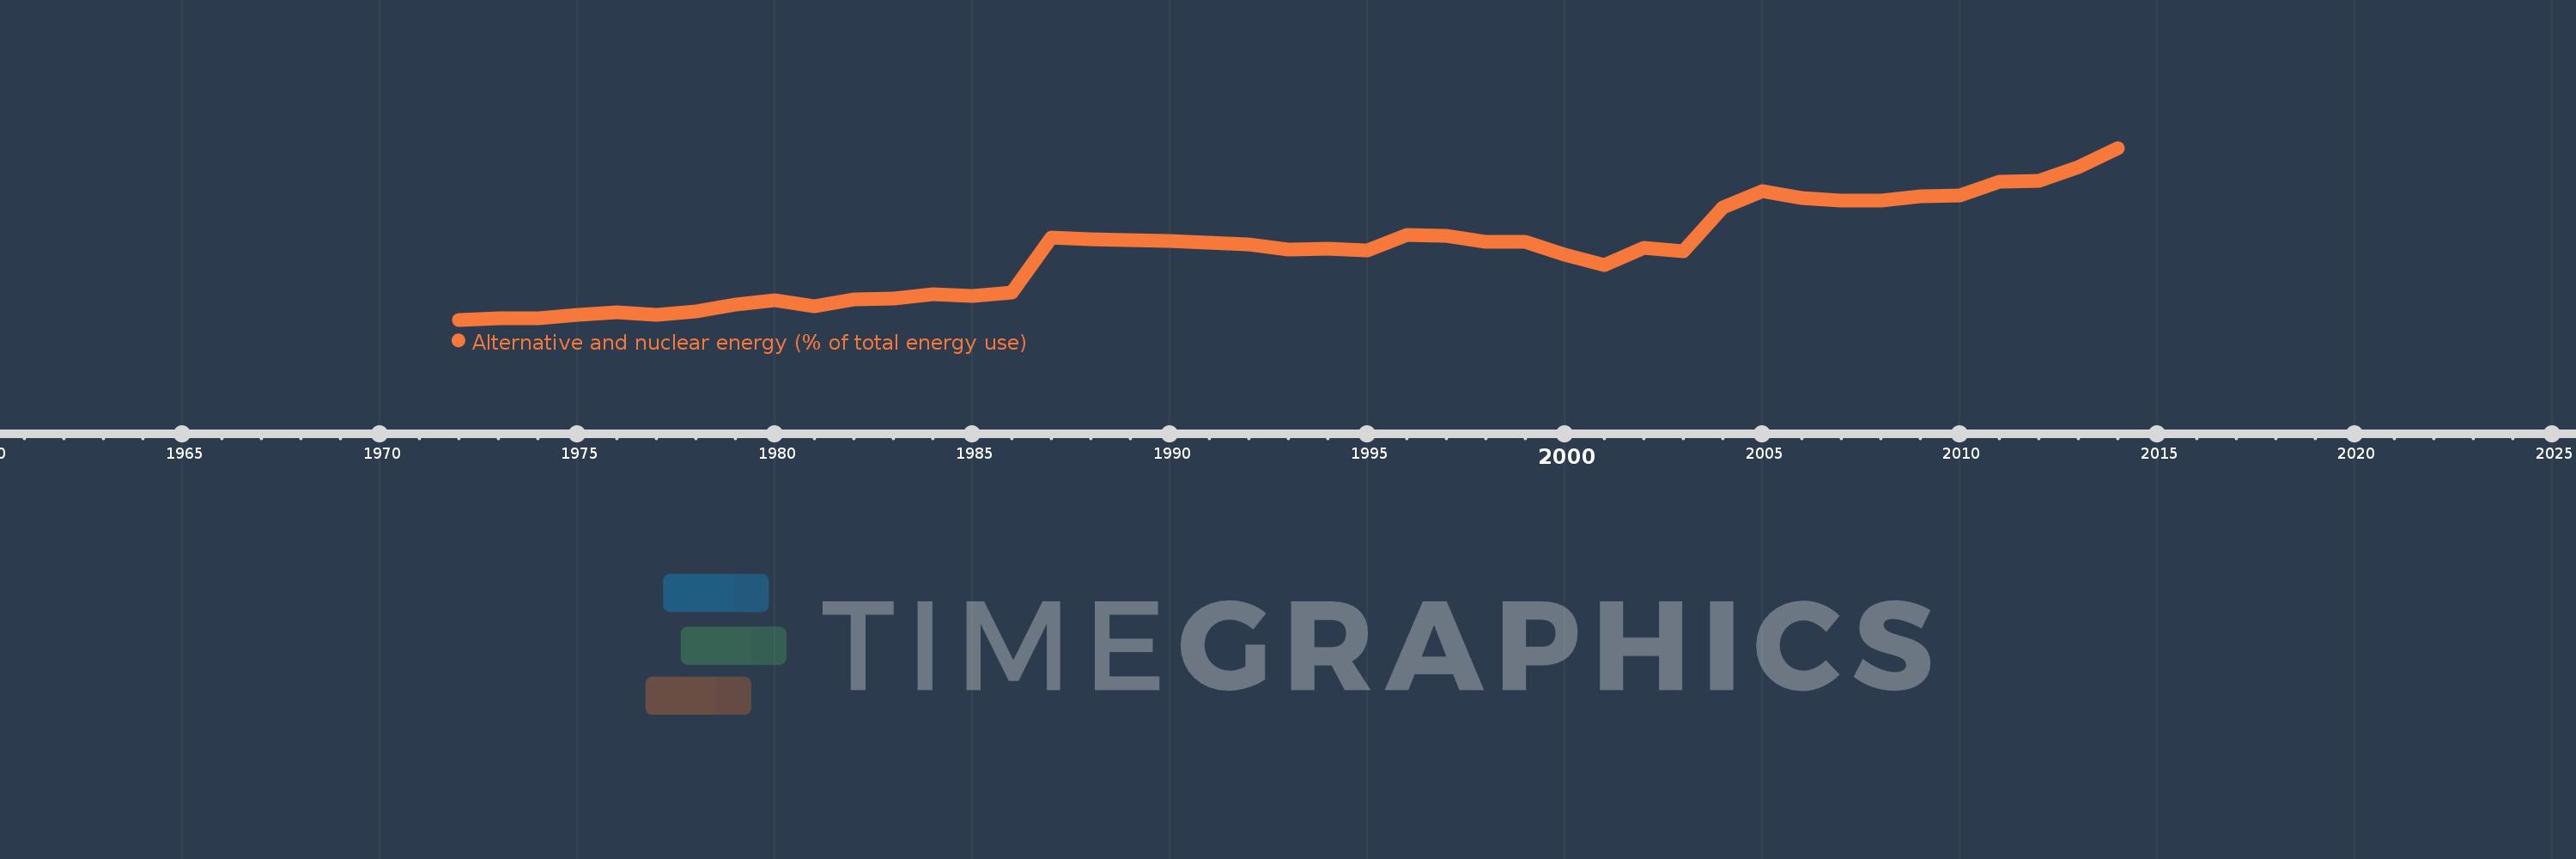
Alternative and nuclear energy (% of total energy use)
2014,2013,2012,2011,2010,2009,2008,2007,2006,2005,2004,2003,2002,2001,2000,1999,1998,1997,1996,1995,1994,1993,1992,1991,1990,1989,1988,1987,1986,1985,1984,1983,1982,1981,1980,1979,1978,1977,1976,1975,1974,1973,1972
This statistics in other country:
AlbaniaAlgeriaAngolaArab WorldArgentinaArmeniaAustraliaAustriaAzerbaijanBahrainBangladeshBelarusBelgiumBeninBoliviaBosnia and HerzegovinaBotswanaBrazilBrunei DarussalamBulgariaCambodiaCameroonCanadaCaribbean small statesCentral Europe and the BalticsChileChinaColombiaCongo, Dem. Rep.Congo, Rep.Costa RicaCote d'IvoireCroatiaCubaCuracaoCyprusCzech RepublicDenmarkDominican RepublicEarly-demographic dividendEast Asia & PacificEast Asia & Pacific (excluding high income)East Asia & Pacific (IDA & IBRD countries)EcuadorEgypt, Arab Rep.El SalvadorEritreaEstoniaEthiopiaEuro areaEurope & Central AsiaEurope & Central Asia (excluding high income)Europe & Central Asia (IDA & IBRD countries)European UnionFinlandFragile and conflict affected situationsFranceGabonGeorgiaGermanyGhanaGibraltarGreeceGuatemalaHaitiHeavily indebted poor countries (HIPC)High incomeHondurasHong Kong SAR, ChinaHungaryIBRD onlyIcelandIDA & IBRD totalIDA blendIDA onlyIDA totalIndiaIndonesiaIran, Islamic Rep.IraqIrelandIsraelItalyJamaicaJapanJordanKazakhstanKenyaKorea, Dem. People’s Rep.Korea, Rep.KosovoKuwaitKyrgyz RepublicLate-demographic dividendLatin America & Caribbean Latin America & Caribbean (excluding high income)Latin America & the Caribbean (IDA & IBRD countries)LatviaLeast developed countries: UN classificationLebanonLibyaLithuaniaLow & middle incomeLow incomeLower middle incomeLuxembourgMacedonia, FYRMalaysiaMaltaMauritiusMexicoMiddle East & North AfricaMiddle East & North Africa (excluding high income)Middle East & North Africa (IDA & IBRD countries)Middle incomeMoldovaMongoliaMontenegroMoroccoMozambiqueMyanmarNamibiaNepalNetherlandsNew ZealandNicaraguaNigerNigeriaNorth AmericaNorwayOECD membersOmanOther small statesPakistanPanamaParaguayPeruPhilippinesPolandPortugalPost-demographic dividendPre-demographic dividendQatarRomaniaRussian FederationSaudi ArabiaSenegalSerbiaSingaporeSlovak RepublicSloveniaSmall statesSouth AfricaSouth AsiaSouth Asia (IDA & IBRD)South SudanSpainSri LankaSub-Saharan Africa Sub-Saharan Africa (excluding high income)Sub-Saharan Africa (IDA & IBRD countries)SudanSwedenSwitzerlandSyrian Arab RepublicTajikistanTanzaniaThailandTogoTrinidad and TobagoTunisiaTurkeyTurkmenistanUkraineUnited Arab EmiratesUnited KingdomUnited StatesUpper middle incomeUruguayUzbekistanVenezuela, RBVietnamWorldYemen, Rep.ZambiaZimbabwe Timeline:
This timeline shows a graph from 1972 to 2014 of Kenya. No data until 1971. Number of actual observations by date: 43.
Source name:
World Development Indicators
Source organization:
IEA Statistics © OECD/IEA 2014 (http://www.iea.org/stats/index.asp), subject to https://www.iea.org/t&c/termsandconditions/
Categories, topics:
Energy & Mining
Last updated:
apr 23, 2017
Indicators value changes by year
At the date of observation
Value
Absolute change
Change from previous value
jan 1, 1972
0.554
+0.554
0.0%
jan 1, 1973
0.627
+0.073
13.11%
jan 1, 1974
0.621
-0.006
-0.9%
jan 1, 1975
0.802
+0.181
29.16%
jan 1, 1976
0.929
+0.127
15.8%
jan 1, 1977
0.795
-0.133
-14.37%
jan 1, 1978
0.973
+0.178
22.38%
jan 1, 1979
1.353
+0.38
39.02%
jan 1, 1980
1.591
+0.238
17.62%
jan 1, 1981
1.243
-0.348
-21.89%
jan 1, 1982
1.619
+0.376
30.25%
jan 1, 1983
1.671
+0.052
3.21%
jan 1, 1984
1.913
+0.242
14.51%
jan 1, 1985
1.791
-0.122
-6.38%
jan 1, 1986
2.007
+0.216
12.04%
jan 1, 1987
4.894
+2.887
143.87%
jan 1, 1988
4.822
-0.072
-1.48%
jan 1, 1989
4.747
-0.075
-1.55%
jan 1, 1990
4.698
-0.049
-1.03%
jan 1, 1991
4.63
-0.068
-1.45%
jan 1, 1992
4.547
-0.083
-1.79%
jan 1, 1993
4.257
-0.29
-6.37%
jan 1, 1994
4.301
+0.044
1.03%
jan 1, 1995
4.227
-0.074
-1.72%
jan 1, 1996
5.014
+0.787
18.61%
jan 1, 1997
4.987
-0.027
-0.53%
jan 1, 1998
4.677
-0.31
-6.21%
jan 1, 1999
4.67
-0.007
-0.15%
jan 1, 2000
3.987
-0.683
-14.62%
jan 1, 2001
3.448
-0.539
-13.52%
jan 1, 2002
4.36
+0.912
26.45%
jan 1, 2003
4.162
-0.198
-4.54%
jan 1, 2004
6.492
+2.329
55.96%
jan 1, 2005
7.319
+0.827
12.74%
jan 1, 2006
6.967
-0.352
-4.81%
jan 1, 2007
6.835
-0.131
-1.89%
jan 1, 2008
6.835
0.0
-0.01%
jan 1, 2009
7.066
+0.231
3.37%
jan 1, 2010
7.115
+0.05
0.7%
jan 1, 2011
7.858
+0.743
10.44%
jan 1, 2012
7.886
+0.028
0.36%
jan 1, 2013
8.592
+0.706
8.96%
jan 1, 2014
9.617
+1.025
11.92%
Ranking of countries by current statistics by years


Comments: