29
/
en
AIzaSyAYiBZKx7MnpbEhh9jyipgxe19OcubqV5w
April 1, 2024
159154
Ireland
IRL
true
2
1
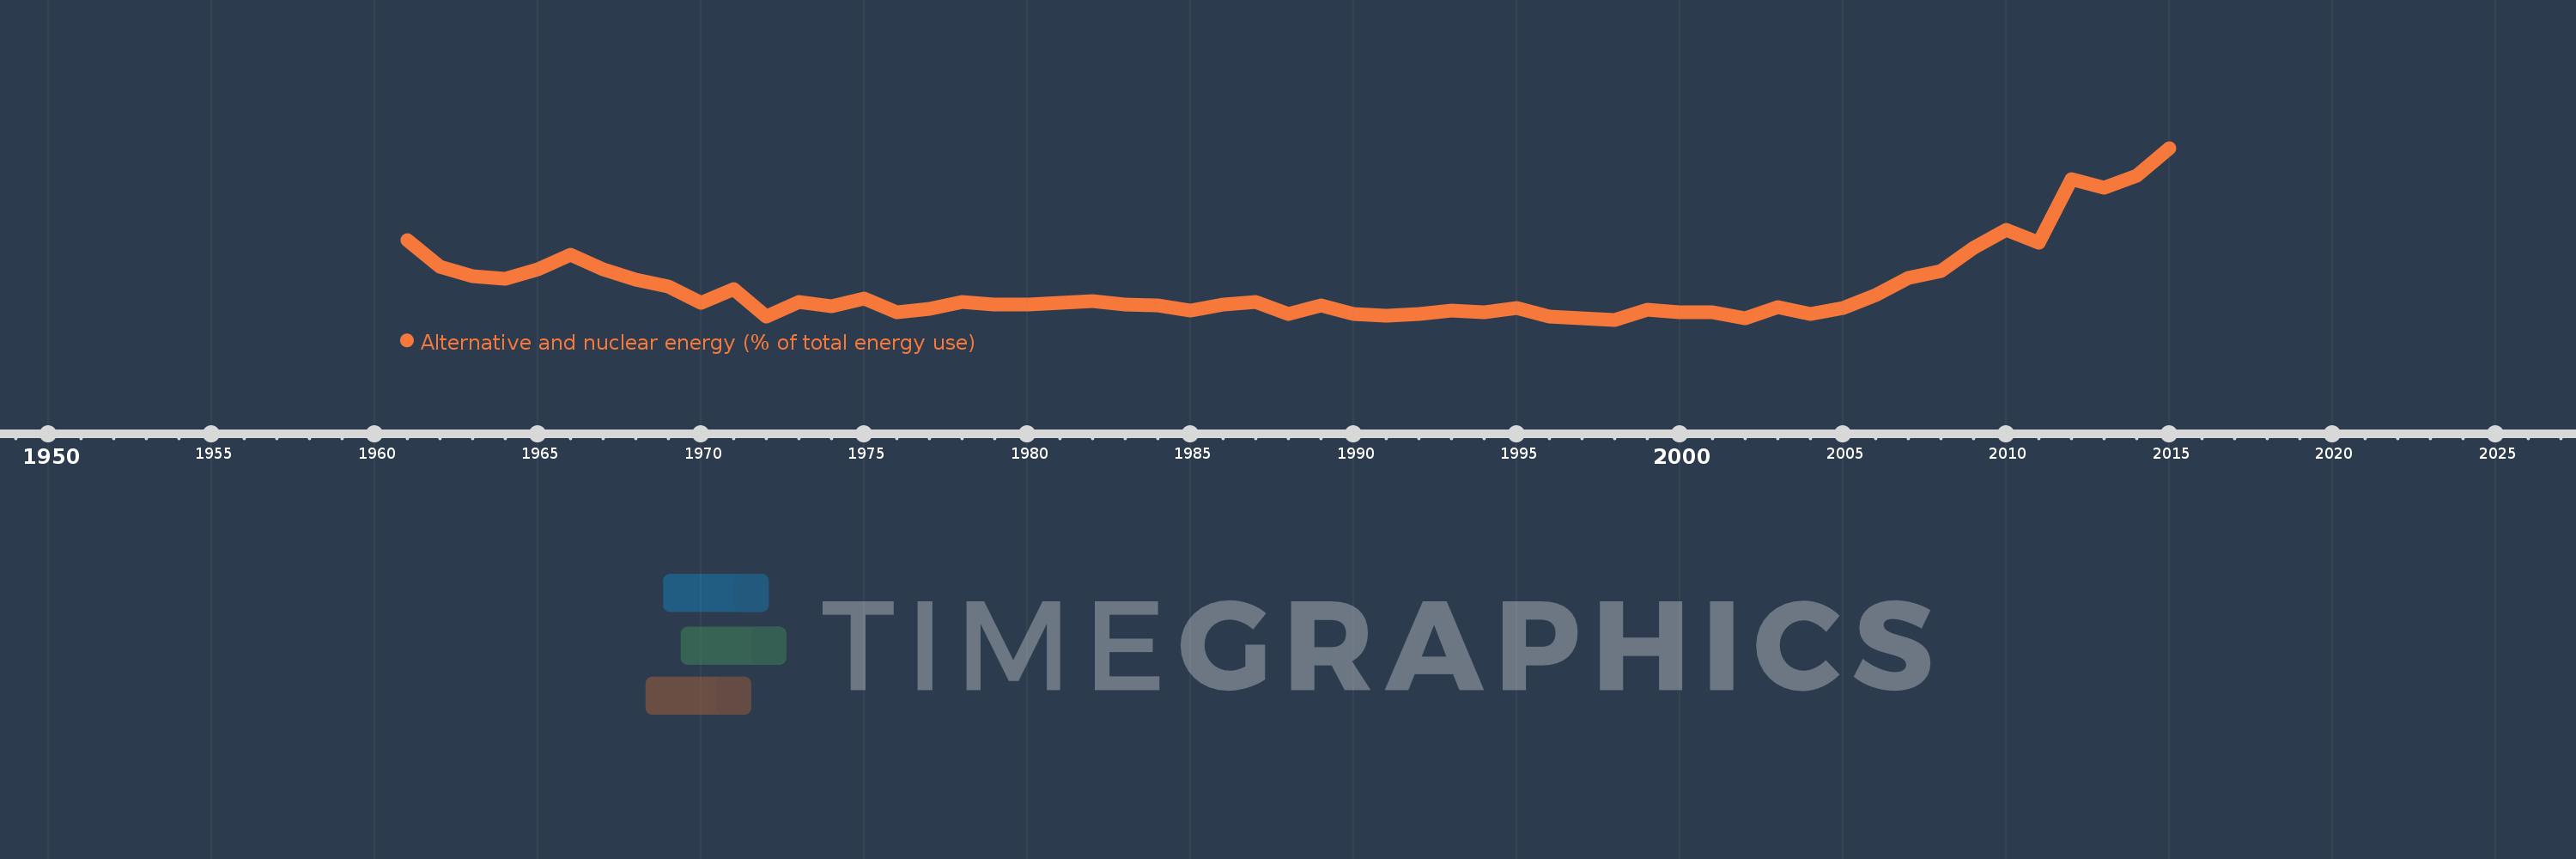
Alternative and nuclear energy (% of total energy use)
2015,2014,2013,2012,2011,2010,2009,2008,2007,2006,2005,2004,2003,2002,2001,2000,1999,1998,1997,1996,1995,1994,1993,1992,1991,1990,1989,1988,1987,1986,1985,1984,1983,1982,1981,1980,1979,1978,1977,1976,1975,1974,1973,1972,1971,1970,1969,1968,1967,1966,1965,1964,1963,1962,1961
This statistics in other country:
AlbaniaAlgeriaAngolaArab WorldArgentinaArmeniaAustraliaAustriaAzerbaijanBahrainBangladeshBelarusBelgiumBeninBoliviaBosnia and HerzegovinaBotswanaBrazilBrunei DarussalamBulgariaCambodiaCameroonCanadaCaribbean small statesCentral Europe and the BalticsChileChinaColombiaCongo, Dem. Rep.Congo, Rep.Costa RicaCote d'IvoireCroatiaCubaCuracaoCyprusCzech RepublicDenmarkDominican RepublicEarly-demographic dividendEast Asia & PacificEast Asia & Pacific (excluding high income)East Asia & Pacific (IDA & IBRD countries)EcuadorEgypt, Arab Rep.El SalvadorEritreaEstoniaEthiopiaEuro areaEurope & Central AsiaEurope & Central Asia (excluding high income)Europe & Central Asia (IDA & IBRD countries)European UnionFinlandFragile and conflict affected situationsFranceGabonGeorgiaGermanyGhanaGibraltarGreeceGuatemalaHaitiHeavily indebted poor countries (HIPC)High incomeHondurasHong Kong SAR, ChinaHungaryIBRD onlyIcelandIDA & IBRD totalIDA blendIDA onlyIDA totalIndiaIndonesiaIran, Islamic Rep.IraqIrelandIsraelItalyJamaicaJapanJordanKazakhstanKenyaKorea, Dem. People’s Rep.Korea, Rep.KosovoKuwaitKyrgyz RepublicLate-demographic dividendLatin America & Caribbean Latin America & Caribbean (excluding high income)Latin America & the Caribbean (IDA & IBRD countries)LatviaLeast developed countries: UN classificationLebanonLibyaLithuaniaLow & middle incomeLow incomeLower middle incomeLuxembourgMacedonia, FYRMalaysiaMaltaMauritiusMexicoMiddle East & North AfricaMiddle East & North Africa (excluding high income)Middle East & North Africa (IDA & IBRD countries)Middle incomeMoldovaMongoliaMontenegroMoroccoMozambiqueMyanmarNamibiaNepalNetherlandsNew ZealandNicaraguaNigerNigeriaNorth AmericaNorwayOECD membersOmanOther small statesPakistanPanamaParaguayPeruPhilippinesPolandPortugalPost-demographic dividendPre-demographic dividendQatarRomaniaRussian FederationSaudi ArabiaSenegalSerbiaSingaporeSlovak RepublicSloveniaSmall statesSouth AfricaSouth AsiaSouth Asia (IDA & IBRD)South SudanSpainSri LankaSub-Saharan Africa Sub-Saharan Africa (excluding high income)Sub-Saharan Africa (IDA & IBRD countries)SudanSwedenSwitzerlandSyrian Arab RepublicTajikistanTanzaniaThailandTogoTrinidad and TobagoTunisiaTurkeyTurkmenistanUkraineUnited Arab EmiratesUnited KingdomUnited StatesUpper middle incomeUruguayUzbekistanVenezuela, RBVietnamWorldYemen, Rep.ZambiaZimbabwe Timeline:
This timeline shows a graph from 1961 to 2015 of Ireland. No data until 1960. Number of actual observations by date: 55.
Source name:
World Development Indicators
Source organization:
IEA Statistics © OECD/IEA 2014 (http://www.iea.org/stats/index.asp), subject to https://www.iea.org/t&c/termsandconditions/
Categories, topics:
Energy & Mining
Last updated:
apr 23, 2017
Indicators value changes by year
At the date of observation
Value
Absolute change
Change from previous value
jan 1, 1961
2.149
+2.149
0.0%
jan 1, 1962
1.609
-0.539
-25.11%
jan 1, 1963
1.415
-0.195
-12.1%
jan 1, 1964
1.358
-0.056
-3.99%
jan 1, 1965
1.545
+0.187
13.77%
jan 1, 1966
1.86
+0.315
20.39%
jan 1, 1967
1.556
-0.304
-16.33%
jan 1, 1968
1.336
-0.22
-14.16%
jan 1, 1969
1.209
-0.127
-9.52%
jan 1, 1970
0.866
-0.343
-28.38%
jan 1, 1971
1.153
+0.287
33.11%
jan 1, 1972
0.597
-0.556
-48.24%
jan 1, 1973
0.88
+0.284
47.53%
jan 1, 1974
0.802
-0.078
-8.9%
jan 1, 1975
0.95
+0.148
18.48%
jan 1, 1976
0.674
-0.276
-29.04%
jan 1, 1977
0.748
+0.074
10.91%
jan 1, 1978
0.891
+0.143
19.11%
jan 1, 1979
0.828
-0.063
-7.06%
jan 1, 1980
0.831
+0.003
0.39%
jan 1, 1981
0.875
+0.044
5.33%
jan 1, 1982
0.897
+0.022
2.52%
jan 1, 1983
0.84
-0.058
-6.43%
jan 1, 1984
0.822
-0.017
-2.07%
jan 1, 1985
0.714
-0.108
-13.16%
jan 1, 1986
0.83
+0.116
16.31%
jan 1, 1987
0.892
+0.062
7.41%
jan 1, 1988
0.634
-0.258
-28.9%
jan 1, 1989
0.821
+0.186
29.39%
jan 1, 1990
0.638
-0.182
-22.2%
jan 1, 1991
0.605
-0.033
-5.18%
jan 1, 1992
0.643
+0.038
6.25%
jan 1, 1993
0.717
+0.074
11.46%
jan 1, 1994
0.668
-0.049
-6.87%
jan 1, 1995
0.766
+0.098
14.67%
jan 1, 1996
0.589
-0.176
-23.0%
jan 1, 1997
0.558
-0.031
-5.3%
jan 1, 1998
0.524
-0.034
-6.08%
jan 1, 1999
0.736
+0.212
40.46%
jan 1, 2000
0.668
-0.068
-9.22%
jan 1, 2001
0.68
+0.012
1.75%
jan 1, 2002
0.558
-0.122
-17.97%
jan 1, 2003
0.778
+0.22
39.41%
jan 1, 2004
0.646
-0.132
-17.0%
jan 1, 2005
0.765
+0.12
18.51%
jan 1, 2006
1.032
+0.267
34.84%
jan 1, 2007
1.383
+0.351
34.06%
jan 1, 2008
1.512
+0.129
9.29%
jan 1, 2009
1.987
+0.476
31.46%
jan 1, 2010
2.357
+0.37
18.61%
jan 1, 2011
2.089
-0.268
-11.38%
jan 1, 2012
3.389
+1.301
62.27%
jan 1, 2013
3.22
-0.169
-4.99%
jan 1, 2014
3.458
+0.238
7.39%
jan 1, 2015
4.031
+0.573
16.57%
Ranking of countries by current statistics by years


Comments: