29
/
en
AIzaSyAYiBZKx7MnpbEhh9jyipgxe19OcubqV5w
April 1, 2024
113236
Cote d'Ivoire
CIV
true
2
1
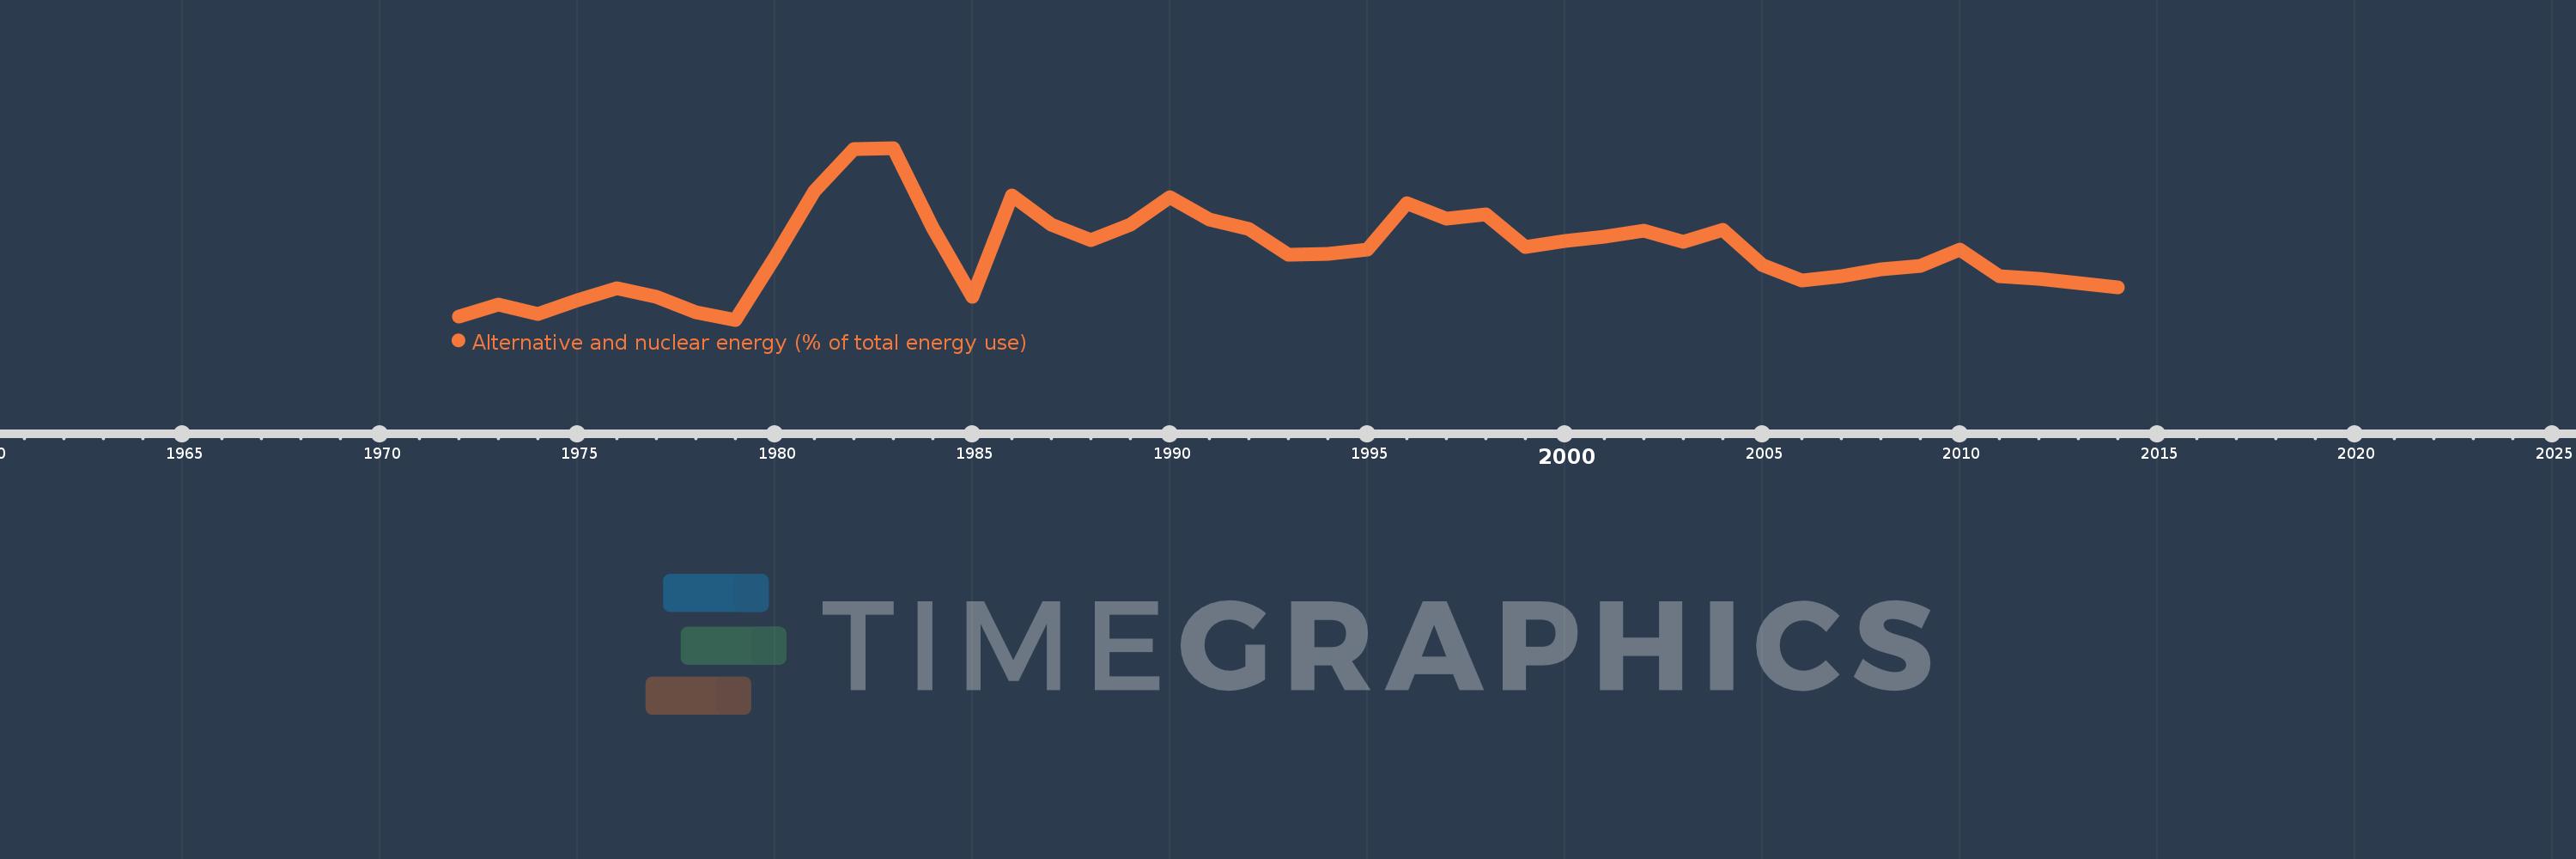
Alternative and nuclear energy (% of total energy use)
2014,2013,2012,2011,2010,2009,2008,2007,2006,2005,2004,2003,2002,2001,2000,1999,1998,1997,1996,1995,1994,1993,1992,1991,1990,1989,1988,1987,1986,1985,1984,1983,1982,1981,1980,1979,1978,1977,1976,1975,1974,1973,1972
This statistics in other country:
AlbaniaAlgeriaAngolaArab WorldArgentinaArmeniaAustraliaAustriaAzerbaijanBahrainBangladeshBelarusBelgiumBeninBoliviaBosnia and HerzegovinaBotswanaBrazilBrunei DarussalamBulgariaCambodiaCameroonCanadaCaribbean small statesCentral Europe and the BalticsChileChinaColombiaCongo, Dem. Rep.Congo, Rep.Costa RicaCote d'IvoireCroatiaCubaCuracaoCyprusCzech RepublicDenmarkDominican RepublicEarly-demographic dividendEast Asia & PacificEast Asia & Pacific (excluding high income)East Asia & Pacific (IDA & IBRD countries)EcuadorEgypt, Arab Rep.El SalvadorEritreaEstoniaEthiopiaEuro areaEurope & Central AsiaEurope & Central Asia (excluding high income)Europe & Central Asia (IDA & IBRD countries)European UnionFinlandFragile and conflict affected situationsFranceGabonGeorgiaGermanyGhanaGibraltarGreeceGuatemalaHaitiHeavily indebted poor countries (HIPC)High incomeHondurasHong Kong SAR, ChinaHungaryIBRD onlyIcelandIDA & IBRD totalIDA blendIDA onlyIDA totalIndiaIndonesiaIran, Islamic Rep.IraqIrelandIsraelItalyJamaicaJapanJordanKazakhstanKenyaKorea, Dem. People’s Rep.Korea, Rep.KosovoKuwaitKyrgyz RepublicLate-demographic dividendLatin America & Caribbean Latin America & Caribbean (excluding high income)Latin America & the Caribbean (IDA & IBRD countries)LatviaLeast developed countries: UN classificationLebanonLibyaLithuaniaLow & middle incomeLow incomeLower middle incomeLuxembourgMacedonia, FYRMalaysiaMaltaMauritiusMexicoMiddle East & North AfricaMiddle East & North Africa (excluding high income)Middle East & North Africa (IDA & IBRD countries)Middle incomeMoldovaMongoliaMontenegroMoroccoMozambiqueMyanmarNamibiaNepalNetherlandsNew ZealandNicaraguaNigerNigeriaNorth AmericaNorwayOECD membersOmanOther small statesPakistanPanamaParaguayPeruPhilippinesPolandPortugalPost-demographic dividendPre-demographic dividendQatarRomaniaRussian FederationSaudi ArabiaSenegalSerbiaSingaporeSlovak RepublicSloveniaSmall statesSouth AfricaSouth AsiaSouth Asia (IDA & IBRD)South SudanSpainSri LankaSub-Saharan Africa Sub-Saharan Africa (excluding high income)Sub-Saharan Africa (IDA & IBRD countries)SudanSwedenSwitzerlandSyrian Arab RepublicTajikistanTanzaniaThailandTogoTrinidad and TobagoTunisiaTurkeyTurkmenistanUkraineUnited Arab EmiratesUnited KingdomUnited StatesUpper middle incomeUruguayUzbekistanVenezuela, RBVietnamWorldYemen, Rep.ZambiaZimbabwe Timeline:
This timeline shows a graph from 1972 to 2014 of Cote d'Ivoire. No data until 1971. Number of actual observations by date: 43.
Source name:
World Development Indicators
Source organization:
IEA Statistics © OECD/IEA 2014 (http://www.iea.org/stats/index.asp), subject to https://www.iea.org/t&c/termsandconditions/
Categories, topics:
Energy & Mining
Last updated:
apr 23, 2017
Indicators value changes by year
At the date of observation
Value
Absolute change
Change from previous value
jan 1, 1972
0.487
+0.487
0.0%
jan 1, 1973
0.746
+0.259
53.22%
jan 1, 1974
0.537
-0.209
-28.04%
jan 1, 1975
0.848
+0.311
57.95%
jan 1, 1976
1.113
+0.265
31.22%
jan 1, 1977
0.927
-0.186
-16.68%
jan 1, 1978
0.587
-0.34
-36.7%
jan 1, 1979
0.413
-0.174
-29.65%
jan 1, 1980
1.784
+1.371
332.13%
jan 1, 1981
3.253
+1.469
82.37%
jan 1, 1982
4.18
+0.927
28.49%
jan 1, 1983
4.196
+0.016
0.37%
jan 1, 1984
2.429
-1.767
-42.11%
jan 1, 1985
0.911
-1.518
-62.49%
jan 1, 1986
3.159
+2.248
246.65%
jan 1, 1987
2.505
-0.654
-20.7%
jan 1, 1988
2.157
-0.348
-13.88%
jan 1, 1989
2.5
+0.343
15.9%
jan 1, 1990
3.103
+0.603
24.1%
jan 1, 1991
2.617
-0.486
-15.67%
jan 1, 1992
2.413
-0.204
-7.79%
jan 1, 1993
1.849
-0.564
-23.37%
jan 1, 1994
1.872
+0.023
1.26%
jan 1, 1995
1.952
+0.08
4.25%
jan 1, 1996
2.977
+1.025
52.53%
jan 1, 1997
2.647
-0.33
-11.07%
jan 1, 1998
2.736
+0.088
3.34%
jan 1, 1999
2.01
-0.726
-26.53%
jan 1, 2000
2.147
+0.137
6.84%
jan 1, 2001
2.234
+0.087
4.05%
jan 1, 2002
2.371
+0.136
6.1%
jan 1, 2003
2.13
-0.24
-10.13%
jan 1, 2004
2.388
+0.257
12.08%
jan 1, 2005
1.617
-0.771
-32.3%
jan 1, 2006
1.285
-0.332
-20.52%
jan 1, 2007
1.373
+0.088
6.86%
jan 1, 2008
1.518
+0.145
10.57%
jan 1, 2009
1.595
+0.077
5.08%
jan 1, 2010
1.954
+0.359
22.52%
jan 1, 2011
1.369
-0.585
-29.94%
jan 1, 2012
1.309
-0.06
-4.36%
jan 1, 2013
1.218
-0.092
-6.99%
jan 1, 2014
1.135
-0.083
-6.82%
Ranking of countries by current statistics by years


Comments: