29
/
en
AIzaSyAYiBZKx7MnpbEhh9jyipgxe19OcubqV5w
April 1, 2024
195176
Mexico
MEX
true
2
1
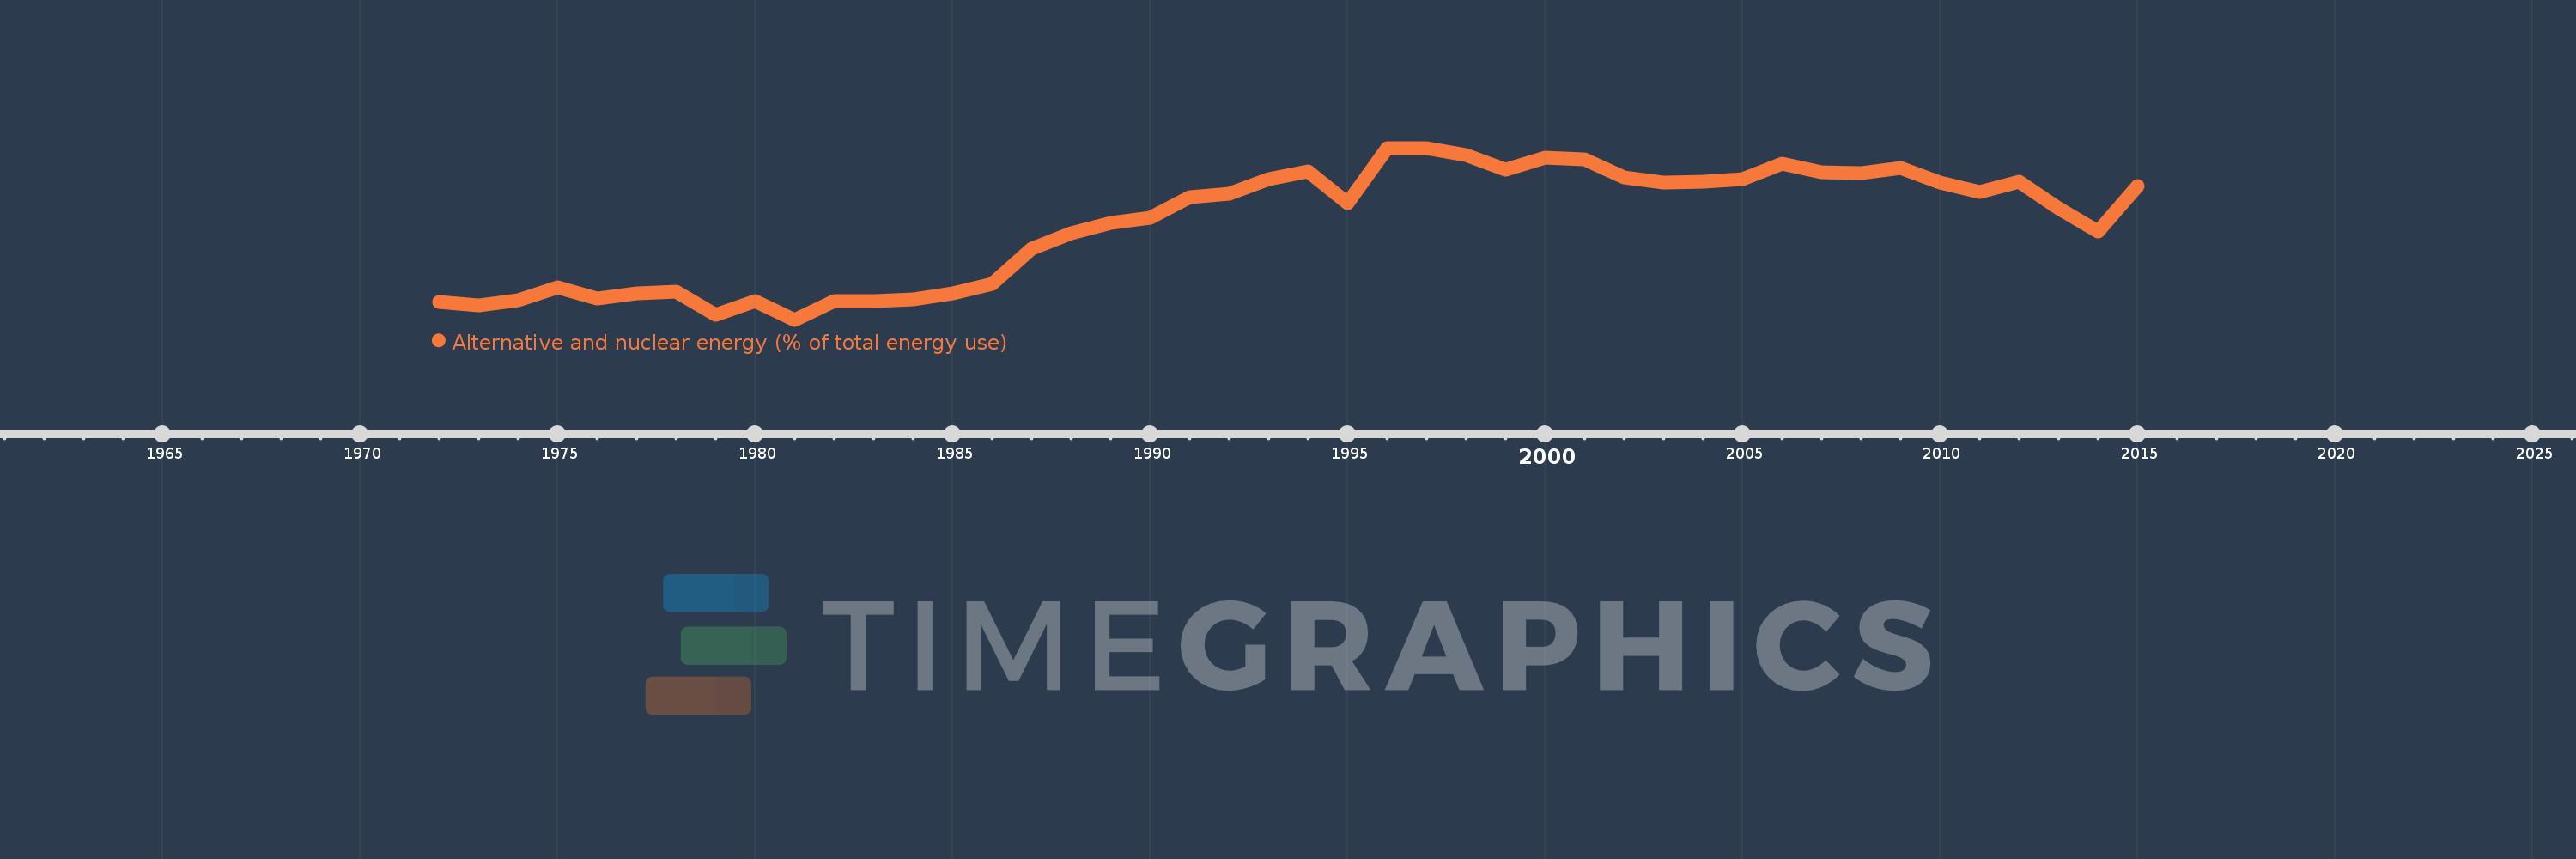
Alternative and nuclear energy (% of total energy use)
2015,2014,2013,2012,2011,2010,2009,2008,2007,2006,2005,2004,2003,2002,2001,2000,1999,1998,1997,1996,1995,1994,1993,1992,1991,1990,1989,1988,1987,1986,1985,1984,1983,1982,1981,1980,1979,1978,1977,1976,1975,1974,1973,1972
This statistics in other country:
AlbaniaAlgeriaAngolaArab WorldArgentinaArmeniaAustraliaAustriaAzerbaijanBahrainBangladeshBelarusBelgiumBeninBoliviaBosnia and HerzegovinaBotswanaBrazilBrunei DarussalamBulgariaCambodiaCameroonCanadaCaribbean small statesCentral Europe and the BalticsChileChinaColombiaCongo, Dem. Rep.Congo, Rep.Costa RicaCote d'IvoireCroatiaCubaCuracaoCyprusCzech RepublicDenmarkDominican RepublicEarly-demographic dividendEast Asia & PacificEast Asia & Pacific (excluding high income)East Asia & Pacific (IDA & IBRD countries)EcuadorEgypt, Arab Rep.El SalvadorEritreaEstoniaEthiopiaEuro areaEurope & Central AsiaEurope & Central Asia (excluding high income)Europe & Central Asia (IDA & IBRD countries)European UnionFinlandFragile and conflict affected situationsFranceGabonGeorgiaGermanyGhanaGibraltarGreeceGuatemalaHaitiHeavily indebted poor countries (HIPC)High incomeHondurasHong Kong SAR, ChinaHungaryIBRD onlyIcelandIDA & IBRD totalIDA blendIDA onlyIDA totalIndiaIndonesiaIran, Islamic Rep.IraqIrelandIsraelItalyJamaicaJapanJordanKazakhstanKenyaKorea, Dem. People’s Rep.Korea, Rep.KosovoKuwaitKyrgyz RepublicLate-demographic dividendLatin America & Caribbean Latin America & Caribbean (excluding high income)Latin America & the Caribbean (IDA & IBRD countries)LatviaLeast developed countries: UN classificationLebanonLibyaLithuaniaLow & middle incomeLow incomeLower middle incomeLuxembourgMacedonia, FYRMalaysiaMaltaMauritiusMexicoMiddle East & North AfricaMiddle East & North Africa (excluding high income)Middle East & North Africa (IDA & IBRD countries)Middle incomeMoldovaMongoliaMontenegroMoroccoMozambiqueMyanmarNamibiaNepalNetherlandsNew ZealandNicaraguaNigerNigeriaNorth AmericaNorwayOECD membersOmanOther small statesPakistanPanamaParaguayPeruPhilippinesPolandPortugalPost-demographic dividendPre-demographic dividendQatarRomaniaRussian FederationSaudi ArabiaSenegalSerbiaSingaporeSlovak RepublicSloveniaSmall statesSouth AfricaSouth AsiaSouth Asia (IDA & IBRD)South SudanSpainSri LankaSub-Saharan Africa Sub-Saharan Africa (excluding high income)Sub-Saharan Africa (IDA & IBRD countries)SudanSwedenSwitzerlandSyrian Arab RepublicTajikistanTanzaniaThailandTogoTrinidad and TobagoTunisiaTurkeyTurkmenistanUkraineUnited Arab EmiratesUnited KingdomUnited StatesUpper middle incomeUruguayUzbekistanVenezuela, RBVietnamWorldYemen, Rep.ZambiaZimbabwe Timeline:
This timeline shows a graph from 1972 to 2015 of Mexico. No data until 1971. Number of actual observations by date: 44.
Source name:
World Development Indicators
Source organization:
IEA Statistics © OECD/IEA 2014 (http://www.iea.org/stats/index.asp), subject to https://www.iea.org/t&c/termsandconditions/
Categories, topics:
Energy & Mining
Last updated:
apr 23, 2017
Indicators value changes by year
At the date of observation
Value
Absolute change
Change from previous value
jan 1, 1972
2.878
+2.878
0.0%
jan 1, 1973
2.777
-0.101
-3.5%
jan 1, 1974
2.912
+0.135
4.86%
jan 1, 1975
3.281
+0.368
12.64%
jan 1, 1976
2.953
-0.327
-9.98%
jan 1, 1977
3.124
+0.17
5.77%
jan 1, 1978
3.155
+0.032
1.01%
jan 1, 1979
2.498
-0.657
-20.83%
jan 1, 1980
2.885
+0.387
15.51%
jan 1, 1981
2.354
-0.532
-18.42%
jan 1, 1982
2.899
+0.545
23.16%
jan 1, 1983
2.9
+0.001
0.02%
jan 1, 1984
2.944
+0.045
1.54%
jan 1, 1985
3.111
+0.167
5.68%
jan 1, 1986
3.376
+0.265
8.51%
jan 1, 1987
4.39
+1.014
30.03%
jan 1, 1988
4.837
+0.446
10.17%
jan 1, 1989
5.134
+0.298
6.16%
jan 1, 1990
5.283
+0.149
2.9%
jan 1, 1991
5.883
+0.6
11.35%
jan 1, 1992
5.995
+0.112
1.91%
jan 1, 1993
6.397
+0.401
6.69%
jan 1, 1994
6.63
+0.233
3.65%
jan 1, 1995
5.709
-0.921
-13.89%
jan 1, 1996
7.286
+1.577
27.63%
jan 1, 1997
7.302
+0.015
0.21%
jan 1, 1998
7.102
-0.2
-2.74%
jan 1, 1999
6.669
-0.434
-6.1%
jan 1, 2000
7.021
+0.352
5.28%
jan 1, 2001
6.982
-0.039
-0.55%
jan 1, 2002
6.443
-0.539
-7.72%
jan 1, 2003
6.293
-0.15
-2.33%
jan 1, 2004
6.323
+0.03
0.47%
jan 1, 2005
6.401
+0.078
1.24%
jan 1, 2006
6.85
+0.449
7.02%
jan 1, 2007
6.609
-0.242
-3.53%
jan 1, 2008
6.586
-0.023
-0.35%
jan 1, 2009
6.718
+0.132
2.0%
jan 1, 2010
6.3
-0.418
-6.22%
jan 1, 2011
6.037
-0.263
-4.18%
jan 1, 2012
6.332
+0.296
4.9%
jan 1, 2013
5.565
-0.768
-12.12%
jan 1, 2014
4.888
-0.677
-12.17%
jan 1, 2015
6.215
+1.327
27.16%
Ranking of countries by current statistics by years


Comments: