29
/
en
AIzaSyAYiBZKx7MnpbEhh9jyipgxe19OcubqV5w
April 1, 2024
156977
Iran, Islamic Rep.
IRN
true
2
1
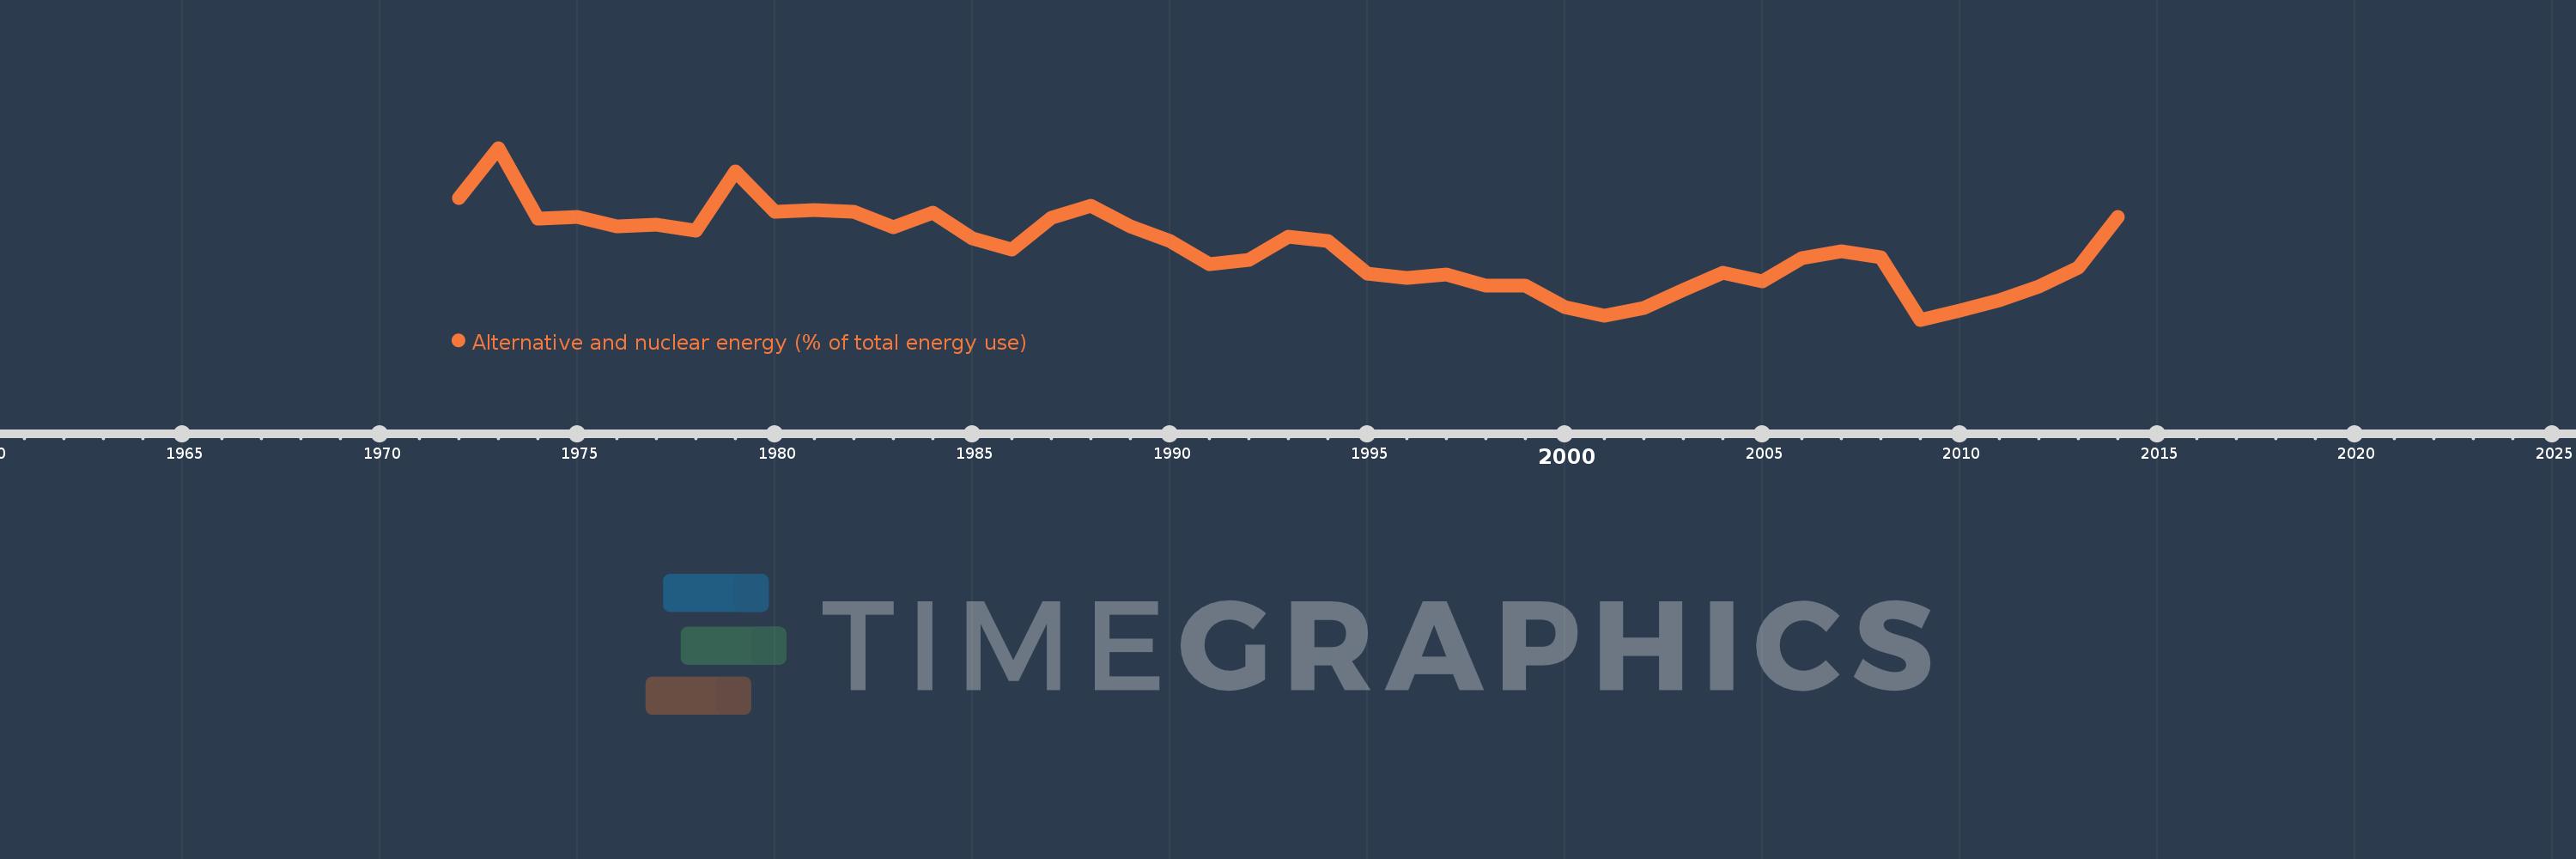
Alternative and nuclear energy (% of total energy use)
2014,2013,2012,2011,2010,2009,2008,2007,2006,2005,2004,2003,2002,2001,2000,1999,1998,1997,1996,1995,1994,1993,1992,1991,1990,1989,1988,1987,1986,1985,1984,1983,1982,1981,1980,1979,1978,1977,1976,1975,1974,1973,1972
This statistics in other country:
AlbaniaAlgeriaAngolaArab WorldArgentinaArmeniaAustraliaAustriaAzerbaijanBahrainBangladeshBelarusBelgiumBeninBoliviaBosnia and HerzegovinaBotswanaBrazilBrunei DarussalamBulgariaCambodiaCameroonCanadaCaribbean small statesCentral Europe and the BalticsChileChinaColombiaCongo, Dem. Rep.Congo, Rep.Costa RicaCote d'IvoireCroatiaCubaCuracaoCyprusCzech RepublicDenmarkDominican RepublicEarly-demographic dividendEast Asia & PacificEast Asia & Pacific (excluding high income)East Asia & Pacific (IDA & IBRD countries)EcuadorEgypt, Arab Rep.El SalvadorEritreaEstoniaEthiopiaEuro areaEurope & Central AsiaEurope & Central Asia (excluding high income)Europe & Central Asia (IDA & IBRD countries)European UnionFinlandFragile and conflict affected situationsFranceGabonGeorgiaGermanyGhanaGibraltarGreeceGuatemalaHaitiHeavily indebted poor countries (HIPC)High incomeHondurasHong Kong SAR, ChinaHungaryIBRD onlyIcelandIDA & IBRD totalIDA blendIDA onlyIDA totalIndiaIndonesiaIran, Islamic Rep.IraqIrelandIsraelItalyJamaicaJapanJordanKazakhstanKenyaKorea, Dem. People’s Rep.Korea, Rep.KosovoKuwaitKyrgyz RepublicLate-demographic dividendLatin America & Caribbean Latin America & Caribbean (excluding high income)Latin America & the Caribbean (IDA & IBRD countries)LatviaLeast developed countries: UN classificationLebanonLibyaLithuaniaLow & middle incomeLow incomeLower middle incomeLuxembourgMacedonia, FYRMalaysiaMaltaMauritiusMexicoMiddle East & North AfricaMiddle East & North Africa (excluding high income)Middle East & North Africa (IDA & IBRD countries)Middle incomeMoldovaMongoliaMontenegroMoroccoMozambiqueMyanmarNamibiaNepalNetherlandsNew ZealandNicaraguaNigerNigeriaNorth AmericaNorwayOECD membersOmanOther small statesPakistanPanamaParaguayPeruPhilippinesPolandPortugalPost-demographic dividendPre-demographic dividendQatarRomaniaRussian FederationSaudi ArabiaSenegalSerbiaSingaporeSlovak RepublicSloveniaSmall statesSouth AfricaSouth AsiaSouth Asia (IDA & IBRD)South SudanSpainSri LankaSub-Saharan Africa Sub-Saharan Africa (excluding high income)Sub-Saharan Africa (IDA & IBRD countries)SudanSwedenSwitzerlandSyrian Arab RepublicTajikistanTanzaniaThailandTogoTrinidad and TobagoTunisiaTurkeyTurkmenistanUkraineUnited Arab EmiratesUnited KingdomUnited StatesUpper middle incomeUruguayUzbekistanVenezuela, RBVietnamWorldYemen, Rep.ZambiaZimbabwe Timeline:
This timeline shows a graph from 1972 to 2014 of Iran, Islamic Rep.. No data until 1971. Number of actual observations by date: 43.
Source name:
World Development Indicators
Source organization:
IEA Statistics © OECD/IEA 2014 (http://www.iea.org/stats/index.asp), subject to https://www.iea.org/t&c/termsandconditions/
Categories, topics:
Energy & Mining
Last updated:
apr 23, 2017
Indicators value changes by year
At the date of observation
Value
Absolute change
Change from previous value
jan 1, 1972
1.387
+1.387
0.0%
jan 1, 1973
1.862
+0.475
34.25%
jan 1, 1974
1.184
-0.679
-36.44%
jan 1, 1975
1.199
+0.015
1.25%
jan 1, 1976
1.112
-0.087
-7.22%
jan 1, 1977
1.128
+0.016
1.4%
jan 1, 1978
1.068
-0.06
-5.33%
jan 1, 1979
1.635
+0.568
53.17%
jan 1, 1980
1.251
-0.384
-23.46%
jan 1, 1981
1.27
+0.018
1.45%
jan 1, 1982
1.25
-0.02
-1.56%
jan 1, 1983
1.106
-0.144
-11.52%
jan 1, 1984
1.245
+0.14
12.64%
jan 1, 1985
0.993
-0.253
-20.31%
jan 1, 1986
0.887
-0.105
-10.61%
jan 1, 1987
1.194
+0.307
34.55%
jan 1, 1988
1.306
+0.112
9.42%
jan 1, 1989
1.114
-0.193
-14.76%
jan 1, 1990
0.976
-0.137
-12.32%
jan 1, 1991
0.754
-0.222
-22.72%
jan 1, 1992
0.789
+0.035
4.64%
jan 1, 1993
1.013
+0.223
28.31%
jan 1, 1994
0.97
-0.043
-4.27%
jan 1, 1995
0.662
-0.308
-31.73%
jan 1, 1996
0.619
-0.043
-6.47%
jan 1, 1997
0.651
+0.032
5.16%
jan 1, 1998
0.545
-0.106
-16.23%
jan 1, 1999
0.544
-0.001
-0.23%
jan 1, 2000
0.339
-0.205
-37.67%
jan 1, 2001
0.258
-0.081
-24.01%
jan 1, 2002
0.328
+0.07
27.28%
jan 1, 2003
0.503
+0.175
53.44%
jan 1, 2004
0.671
+0.167
33.22%
jan 1, 2005
0.59
-0.081
-12.02%
jan 1, 2006
0.805
+0.215
36.51%
jan 1, 2007
0.876
+0.071
8.82%
jan 1, 2008
0.817
-0.06
-6.83%
jan 1, 2009
0.219
-0.598
-73.24%
jan 1, 2010
0.309
+0.091
41.46%
jan 1, 2011
0.402
+0.092
29.91%
jan 1, 2012
0.537
+0.136
33.76%
jan 1, 2013
0.715
+0.178
33.07%
jan 1, 2014
1.2
+0.485
67.82%
Ranking of countries by current statistics by years


Comments: