29
/
en
AIzaSyAYiBZKx7MnpbEhh9jyipgxe19OcubqV5w
April 1, 2024
158199
Iraq
IRQ
true
2
1
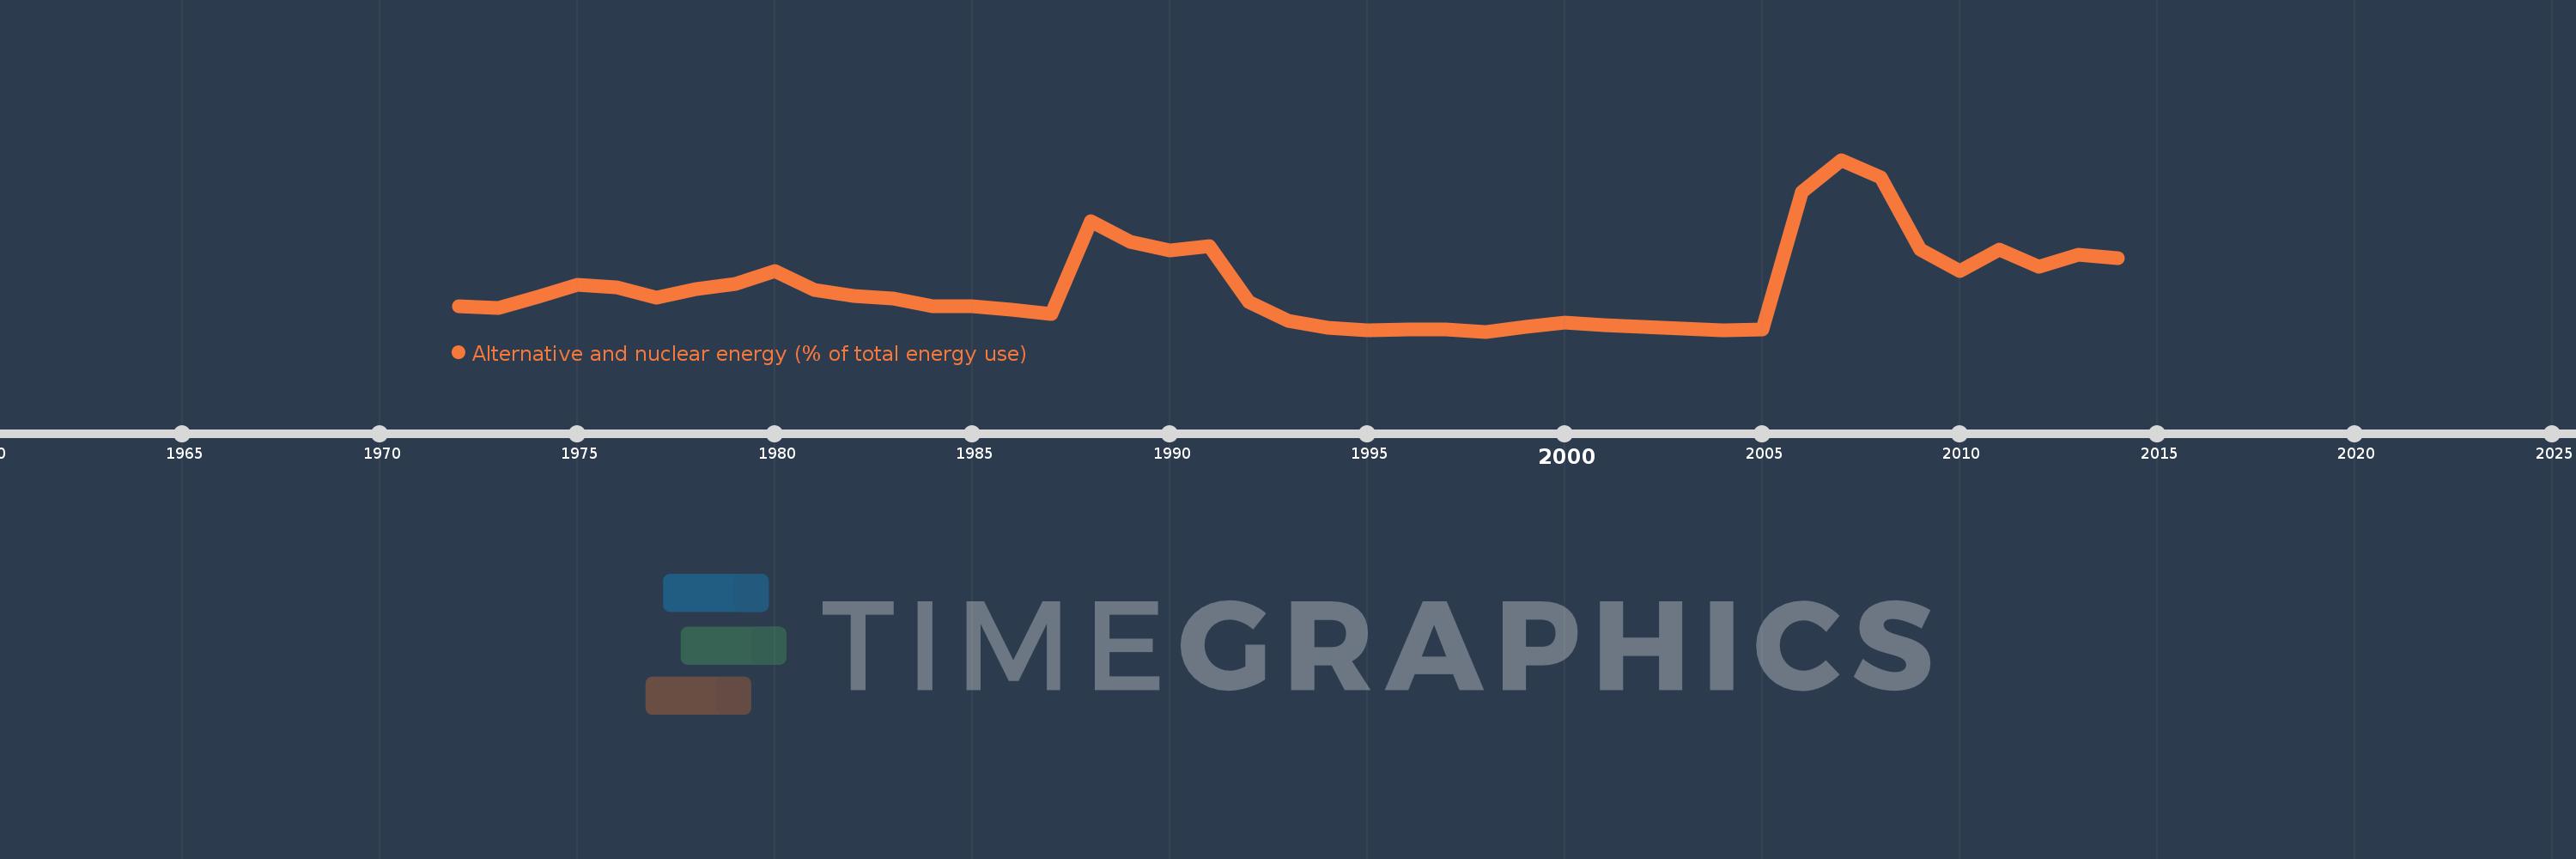
Alternative and nuclear energy (% of total energy use)
2014,2013,2012,2011,2010,2009,2008,2007,2006,2005,2004,2003,2002,2001,2000,1999,1998,1997,1996,1995,1994,1993,1992,1991,1990,1989,1988,1987,1986,1985,1984,1983,1982,1981,1980,1979,1978,1977,1976,1975,1974,1973,1972
This statistics in other country:
AlbaniaAlgeriaAngolaArab WorldArgentinaArmeniaAustraliaAustriaAzerbaijanBahrainBangladeshBelarusBelgiumBeninBoliviaBosnia and HerzegovinaBotswanaBrazilBrunei DarussalamBulgariaCambodiaCameroonCanadaCaribbean small statesCentral Europe and the BalticsChileChinaColombiaCongo, Dem. Rep.Congo, Rep.Costa RicaCote d'IvoireCroatiaCubaCuracaoCyprusCzech RepublicDenmarkDominican RepublicEarly-demographic dividendEast Asia & PacificEast Asia & Pacific (excluding high income)East Asia & Pacific (IDA & IBRD countries)EcuadorEgypt, Arab Rep.El SalvadorEritreaEstoniaEthiopiaEuro areaEurope & Central AsiaEurope & Central Asia (excluding high income)Europe & Central Asia (IDA & IBRD countries)European UnionFinlandFragile and conflict affected situationsFranceGabonGeorgiaGermanyGhanaGibraltarGreeceGuatemalaHaitiHeavily indebted poor countries (HIPC)High incomeHondurasHong Kong SAR, ChinaHungaryIBRD onlyIcelandIDA & IBRD totalIDA blendIDA onlyIDA totalIndiaIndonesiaIran, Islamic Rep.IraqIrelandIsraelItalyJamaicaJapanJordanKazakhstanKenyaKorea, Dem. People’s Rep.Korea, Rep.KosovoKuwaitKyrgyz RepublicLate-demographic dividendLatin America & Caribbean Latin America & Caribbean (excluding high income)Latin America & the Caribbean (IDA & IBRD countries)LatviaLeast developed countries: UN classificationLebanonLibyaLithuaniaLow & middle incomeLow incomeLower middle incomeLuxembourgMacedonia, FYRMalaysiaMaltaMauritiusMexicoMiddle East & North AfricaMiddle East & North Africa (excluding high income)Middle East & North Africa (IDA & IBRD countries)Middle incomeMoldovaMongoliaMontenegroMoroccoMozambiqueMyanmarNamibiaNepalNetherlandsNew ZealandNicaraguaNigerNigeriaNorth AmericaNorwayOECD membersOmanOther small statesPakistanPanamaParaguayPeruPhilippinesPolandPortugalPost-demographic dividendPre-demographic dividendQatarRomaniaRussian FederationSaudi ArabiaSenegalSerbiaSingaporeSlovak RepublicSloveniaSmall statesSouth AfricaSouth AsiaSouth Asia (IDA & IBRD)South SudanSpainSri LankaSub-Saharan Africa Sub-Saharan Africa (excluding high income)Sub-Saharan Africa (IDA & IBRD countries)SudanSwedenSwitzerlandSyrian Arab RepublicTajikistanTanzaniaThailandTogoTrinidad and TobagoTunisiaTurkeyTurkmenistanUkraineUnited Arab EmiratesUnited KingdomUnited StatesUpper middle incomeUruguayUzbekistanVenezuela, RBVietnamWorldYemen, Rep.ZambiaZimbabwe Timeline:
This timeline shows a graph from 1972 to 2014 of Iraq. No data until 1971. Number of actual observations by date: 43.
Source name:
World Development Indicators
Source organization:
IEA Statistics © OECD/IEA 2014 (http://www.iea.org/stats/index.asp), subject to https://www.iea.org/t&c/termsandconditions/
Categories, topics:
Energy & Mining
Last updated:
apr 23, 2017
Indicators value changes by year
At the date of observation
Value
Absolute change
Change from previous value
jan 1, 1972
0.428
+0.428
0.0%
jan 1, 1973
0.401
-0.027
-6.34%
jan 1, 1974
0.535
+0.135
33.64%
jan 1, 1975
0.679
+0.144
26.88%
jan 1, 1976
0.65
-0.029
-4.24%
jan 1, 1977
0.523
-0.127
-19.52%
jan 1, 1978
0.624
+0.1
19.15%
jan 1, 1979
0.685
+0.061
9.8%
jan 1, 1980
0.837
+0.153
22.27%
jan 1, 1981
0.616
-0.222
-26.49%
jan 1, 1982
0.548
-0.068
-11.05%
jan 1, 1983
0.518
-0.03
-5.44%
jan 1, 1984
0.429
-0.088
-17.07%
jan 1, 1985
0.428
-0.001
-0.31%
jan 1, 1986
0.38
-0.048
-11.3%
jan 1, 1987
0.329
-0.05
-13.26%
jan 1, 1988
1.432
+1.103
334.92%
jan 1, 1989
1.181
-0.251
-17.52%
jan 1, 1990
1.082
-0.099
-8.4%
jan 1, 1991
1.134
+0.052
4.82%
jan 1, 1992
0.472
-0.663
-58.42%
jan 1, 1993
0.249
-0.223
-47.28%
jan 1, 1994
0.167
-0.081
-32.74%
jan 1, 1995
0.138
-0.029
-17.62%
jan 1, 1996
0.146
+0.009
6.25%
jan 1, 1997
0.147
+0.0
0.24%
jan 1, 1998
0.125
-0.022
-14.99%
jan 1, 1999
0.178
+0.053
42.5%
jan 1, 2000
0.234
+0.057
31.87%
jan 1, 2001
0.202
-0.033
-14.01%
jan 1, 2002
0.183
-0.019
-9.44%
jan 1, 2003
0.158
-0.025
-13.64%
jan 1, 2004
0.139
-0.019
-11.96%
jan 1, 2005
0.146
+0.007
5.18%
jan 1, 2006
1.769
+1.623
1.11K%
jan 1, 2007
2.153
+0.384
21.71%
jan 1, 2008
1.945
-0.208
-9.65%
jan 1, 2009
1.091
-0.854
-43.92%
jan 1, 2010
0.843
-0.248
-22.74%
jan 1, 2011
1.091
+0.249
29.5%
jan 1, 2012
0.893
-0.198
-18.18%
jan 1, 2013
1.037
+0.145
16.21%
jan 1, 2014
0.995
-0.042
-4.05%
Ranking of countries by current statistics by years


Comments: