29
/
en
AIzaSyAYiBZKx7MnpbEhh9jyipgxe19OcubqV5w
April 1, 2024
252694
Sudan
SDN
true
2
1
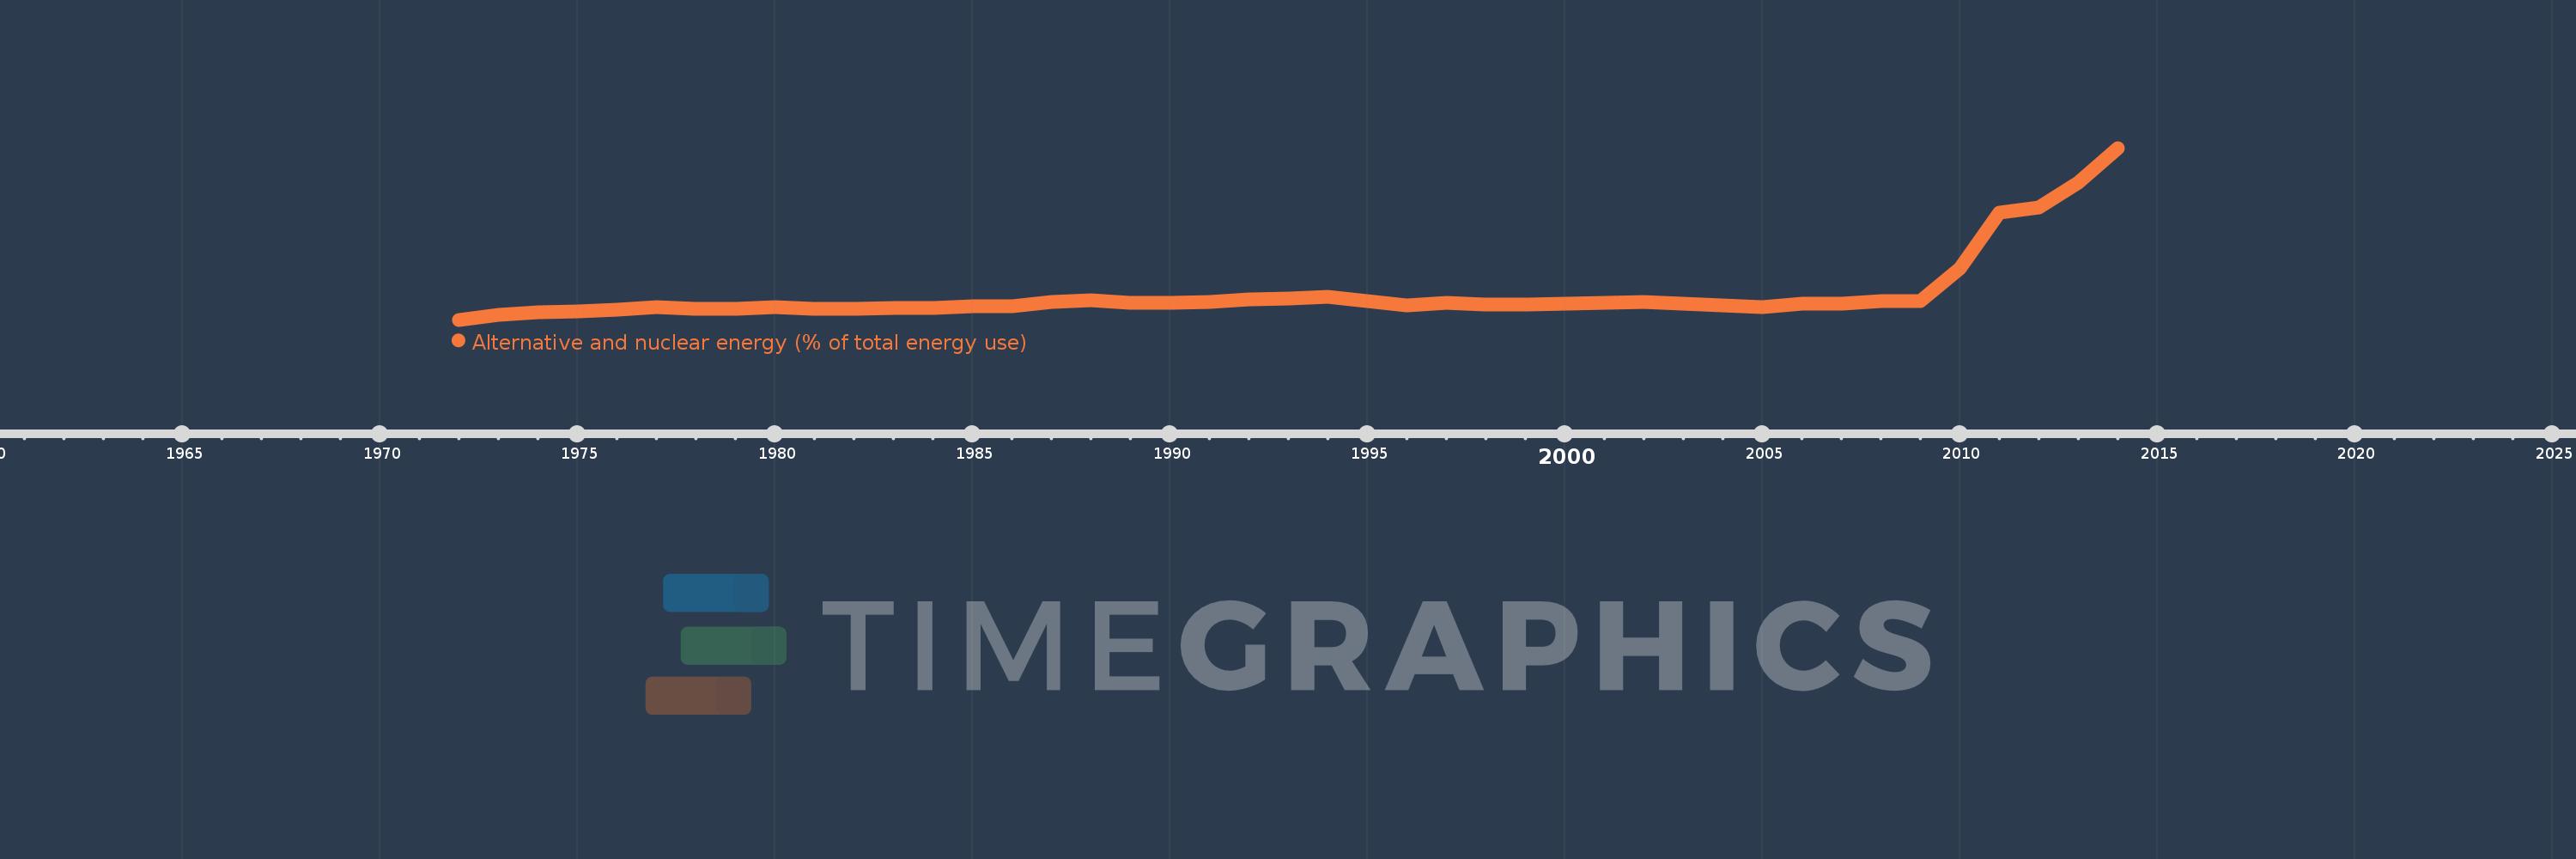
Alternative and nuclear energy (% of total energy use)
2014,2013,2012,2011,2010,2009,2008,2007,2006,2005,2004,2003,2002,2001,2000,1999,1998,1997,1996,1995,1994,1993,1992,1991,1990,1989,1988,1987,1986,1985,1984,1983,1982,1981,1980,1979,1978,1977,1976,1975,1974,1973,1972
This statistics in other country:
AlbaniaAlgeriaAngolaArab WorldArgentinaArmeniaAustraliaAustriaAzerbaijanBahrainBangladeshBelarusBelgiumBeninBoliviaBosnia and HerzegovinaBotswanaBrazilBrunei DarussalamBulgariaCambodiaCameroonCanadaCaribbean small statesCentral Europe and the BalticsChileChinaColombiaCongo, Dem. Rep.Congo, Rep.Costa RicaCote d'IvoireCroatiaCubaCuracaoCyprusCzech RepublicDenmarkDominican RepublicEarly-demographic dividendEast Asia & PacificEast Asia & Pacific (excluding high income)East Asia & Pacific (IDA & IBRD countries)EcuadorEgypt, Arab Rep.El SalvadorEritreaEstoniaEthiopiaEuro areaEurope & Central AsiaEurope & Central Asia (excluding high income)Europe & Central Asia (IDA & IBRD countries)European UnionFinlandFragile and conflict affected situationsFranceGabonGeorgiaGermanyGhanaGibraltarGreeceGuatemalaHaitiHeavily indebted poor countries (HIPC)High incomeHondurasHong Kong SAR, ChinaHungaryIBRD onlyIcelandIDA & IBRD totalIDA blendIDA onlyIDA totalIndiaIndonesiaIran, Islamic Rep.IraqIrelandIsraelItalyJamaicaJapanJordanKazakhstanKenyaKorea, Dem. People’s Rep.Korea, Rep.KosovoKuwaitKyrgyz RepublicLate-demographic dividendLatin America & Caribbean Latin America & Caribbean (excluding high income)Latin America & the Caribbean (IDA & IBRD countries)LatviaLeast developed countries: UN classificationLebanonLibyaLithuaniaLow & middle incomeLow incomeLower middle incomeLuxembourgMacedonia, FYRMalaysiaMaltaMauritiusMexicoMiddle East & North AfricaMiddle East & North Africa (excluding high income)Middle East & North Africa (IDA & IBRD countries)Middle incomeMoldovaMongoliaMontenegroMoroccoMozambiqueMyanmarNamibiaNepalNetherlandsNew ZealandNicaraguaNigerNigeriaNorth AmericaNorwayOECD membersOmanOther small statesPakistanPanamaParaguayPeruPhilippinesPolandPortugalPost-demographic dividendPre-demographic dividendQatarRomaniaRussian FederationSaudi ArabiaSenegalSerbiaSingaporeSlovak RepublicSloveniaSmall statesSouth AfricaSouth AsiaSouth Asia (IDA & IBRD)South SudanSpainSri LankaSub-Saharan Africa Sub-Saharan Africa (excluding high income)Sub-Saharan Africa (IDA & IBRD countries)SudanSwedenSwitzerlandSyrian Arab RepublicTajikistanTanzaniaThailandTogoTrinidad and TobagoTunisiaTurkeyTurkmenistanUkraineUnited Arab EmiratesUnited KingdomUnited StatesUpper middle incomeUruguayUzbekistanVenezuela, RBVietnamWorldYemen, Rep.ZambiaZimbabwe Timeline:
This timeline shows a graph from 1972 to 2014 of Sudan. No data until 1971. Number of actual observations by date: 43.
Source name:
World Development Indicators
Source organization:
IEA Statistics © OECD/IEA 2014 (http://www.iea.org/stats/index.asp), subject to https://www.iea.org/t&c/termsandconditions/
Categories, topics:
Energy & Mining
Last updated:
apr 23, 2017
Indicators value changes by year
At the date of observation
Value
Absolute change
Change from previous value
jan 1, 1973
0.439
+0.139
46.43%
jan 1, 1974
0.499
+0.06
13.56%
jan 1, 1975
0.536
+0.038
7.54%
jan 1, 1976
0.577
+0.041
7.63%
jan 1, 1977
0.649
+0.072
12.44%
jan 1, 1978
0.592
-0.057
-8.79%
jan 1, 1979
0.599
+0.008
1.27%
jan 1, 1980
0.648
+0.049
8.12%
jan 1, 1981
0.588
-0.06
-9.25%
jan 1, 1982
0.6
+0.012
1.98%
jan 1, 1983
0.615
+0.015
2.52%
jan 1, 1984
0.616
+0.002
0.25%
jan 1, 1985
0.658
+0.042
6.75%
jan 1, 1986
0.669
+0.011
1.73%
jan 1, 1987
0.781
+0.111
16.64%
jan 1, 1988
0.818
+0.037
4.74%
jan 1, 1989
0.764
-0.054
-6.62%
jan 1, 1990
0.767
+0.003
0.38%
jan 1, 1991
0.775
+0.009
1.12%
jan 1, 1992
0.841
+0.066
8.56%
jan 1, 1993
0.883
+0.042
4.98%
jan 1, 1994
0.911
+0.028
3.16%
jan 1, 1995
0.808
-0.103
-11.35%
jan 1, 1996
0.698
-0.11
-13.62%
jan 1, 1997
0.753
+0.055
7.86%
jan 1, 1998
0.723
-0.03
-3.94%
jan 1, 1999
0.708
-0.016
-2.15%
jan 1, 2000
0.739
+0.032
4.49%
jan 1, 2001
0.765
+0.025
3.43%
jan 1, 2002
0.782
+0.018
2.32%
jan 1, 2003
0.731
-0.051
-6.51%
jan 1, 2004
0.68
-0.052
-7.04%
jan 1, 2005
0.647
-0.033
-4.78%
jan 1, 2006
0.724
+0.077
11.82%
jan 1, 2007
0.732
+0.008
1.15%
jan 1, 2008
0.802
+0.07
9.52%
jan 1, 2009
0.796
-0.006
-0.72%
jan 1, 2010
1.698
+0.902
113.3%
jan 1, 2011
3.194
+1.496
88.09%
jan 1, 2012
3.342
+0.148
4.63%
jan 1, 2013
4.005
+0.662
19.81%
jan 1, 2014
4.954
+0.95
23.71%
Ranking of countries by current statistics by years


Comments: