29
/
en
AIzaSyAYiBZKx7MnpbEhh9jyipgxe19OcubqV5w
April 1, 2024
163514
Japan
JPN
true
2
1
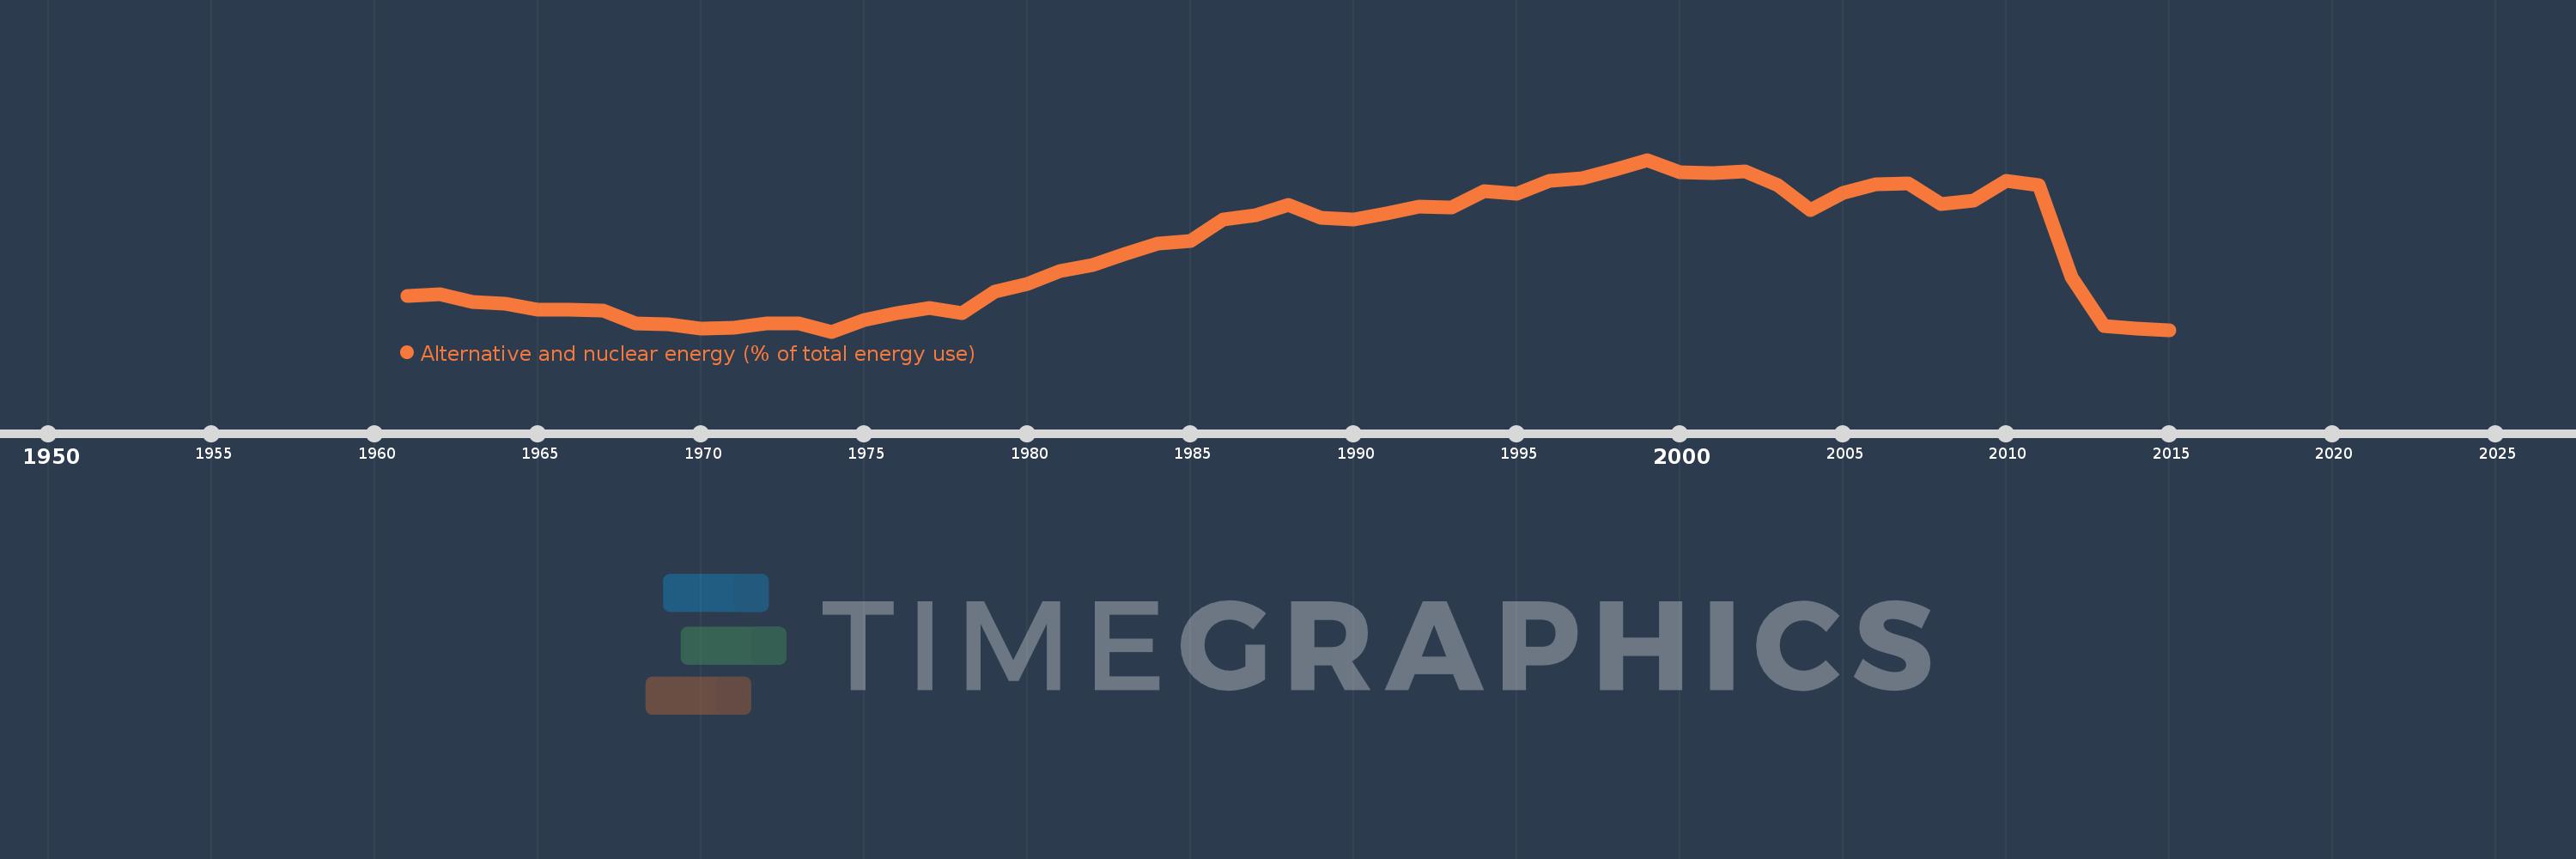
Alternative and nuclear energy (% of total energy use)
2015,2014,2013,2012,2011,2010,2009,2008,2007,2006,2005,2004,2003,2002,2001,2000,1999,1998,1997,1996,1995,1994,1993,1992,1991,1990,1989,1988,1987,1986,1985,1984,1983,1982,1981,1980,1979,1978,1977,1976,1975,1974,1973,1972,1971,1970,1969,1968,1967,1966,1965,1964,1963,1962,1961
This statistics in other country:
AlbaniaAlgeriaAngolaArab WorldArgentinaArmeniaAustraliaAustriaAzerbaijanBahrainBangladeshBelarusBelgiumBeninBoliviaBosnia and HerzegovinaBotswanaBrazilBrunei DarussalamBulgariaCambodiaCameroonCanadaCaribbean small statesCentral Europe and the BalticsChileChinaColombiaCongo, Dem. Rep.Congo, Rep.Costa RicaCote d'IvoireCroatiaCubaCuracaoCyprusCzech RepublicDenmarkDominican RepublicEarly-demographic dividendEast Asia & PacificEast Asia & Pacific (excluding high income)East Asia & Pacific (IDA & IBRD countries)EcuadorEgypt, Arab Rep.El SalvadorEritreaEstoniaEthiopiaEuro areaEurope & Central AsiaEurope & Central Asia (excluding high income)Europe & Central Asia (IDA & IBRD countries)European UnionFinlandFragile and conflict affected situationsFranceGabonGeorgiaGermanyGhanaGibraltarGreeceGuatemalaHaitiHeavily indebted poor countries (HIPC)High incomeHondurasHong Kong SAR, ChinaHungaryIBRD onlyIcelandIDA & IBRD totalIDA blendIDA onlyIDA totalIndiaIndonesiaIran, Islamic Rep.IraqIrelandIsraelItalyJamaicaJapanJordanKazakhstanKenyaKorea, Dem. People’s Rep.Korea, Rep.KosovoKuwaitKyrgyz RepublicLate-demographic dividendLatin America & Caribbean Latin America & Caribbean (excluding high income)Latin America & the Caribbean (IDA & IBRD countries)LatviaLeast developed countries: UN classificationLebanonLibyaLithuaniaLow & middle incomeLow incomeLower middle incomeLuxembourgMacedonia, FYRMalaysiaMaltaMauritiusMexicoMiddle East & North AfricaMiddle East & North Africa (excluding high income)Middle East & North Africa (IDA & IBRD countries)Middle incomeMoldovaMongoliaMontenegroMoroccoMozambiqueMyanmarNamibiaNepalNetherlandsNew ZealandNicaraguaNigerNigeriaNorth AmericaNorwayOECD membersOmanOther small statesPakistanPanamaParaguayPeruPhilippinesPolandPortugalPost-demographic dividendPre-demographic dividendQatarRomaniaRussian FederationSaudi ArabiaSenegalSerbiaSingaporeSlovak RepublicSloveniaSmall statesSouth AfricaSouth AsiaSouth Asia (IDA & IBRD)South SudanSpainSri LankaSub-Saharan Africa Sub-Saharan Africa (excluding high income)Sub-Saharan Africa (IDA & IBRD countries)SudanSwedenSwitzerlandSyrian Arab RepublicTajikistanTanzaniaThailandTogoTrinidad and TobagoTunisiaTurkeyTurkmenistanUkraineUnited Arab EmiratesUnited KingdomUnited StatesUpper middle incomeUruguayUzbekistanVenezuela, RBVietnamWorldYemen, Rep.ZambiaZimbabwe Timeline:
This timeline shows a graph from 1961 to 2015 of Japan. No data until 1960. Number of actual observations by date: 55.
Source name:
World Development Indicators
Source organization:
IEA Statistics © OECD/IEA 2014 (http://www.iea.org/stats/index.asp), subject to https://www.iea.org/t&c/termsandconditions/
Categories, topics:
Energy & Mining
Last updated:
apr 23, 2017
Indicators value changes by year
Maximum:
19.701
jan 1, 1999
At the date of observation
Value
Absolute change
Change from previous value
jan 1, 1961
6.224
+6.224
0.0%
jan 1, 1962
6.397
+0.173
2.78%
jan 1, 1963
5.579
-0.818
-12.79%
jan 1, 1964
5.391
-0.188
-3.37%
jan 1, 1965
4.796
-0.595
-11.03%
jan 1, 1966
4.859
+0.063
1.31%
jan 1, 1967
4.736
-0.123
-2.53%
jan 1, 1968
3.492
-1.244
-26.27%
jan 1, 1969
3.357
-0.135
-3.85%
jan 1, 1970
2.99
-0.368
-10.95%
jan 1, 1971
2.995
+0.005
0.18%
jan 1, 1972
3.486
+0.491
16.39%
jan 1, 1973
3.426
-0.06
-1.72%
jan 1, 1974
2.654
-0.772
-22.52%
jan 1, 1975
3.828
+1.173
44.2%
jan 1, 1976
4.526
+0.698
18.25%
jan 1, 1977
5.006
+0.48
10.62%
jan 1, 1978
4.477
-0.529
-10.57%
jan 1, 1979
6.605
+2.128
47.53%
jan 1, 1980
7.389
+0.784
11.86%
jan 1, 1981
8.676
+1.287
17.42%
jan 1, 1982
9.255
+0.58
6.68%
jan 1, 1983
10.345
+1.089
11.77%
jan 1, 1984
11.365
+1.02
9.86%
jan 1, 1985
11.683
+0.318
2.8%
jan 1, 1986
13.778
+2.095
17.93%
jan 1, 1987
14.17
+0.393
2.85%
jan 1, 1988
15.222
+1.052
7.42%
jan 1, 1989
13.957
-1.265
-8.31%
jan 1, 1990
13.752
-0.205
-1.47%
jan 1, 1991
14.374
+0.621
4.52%
jan 1, 1992
15.051
+0.678
4.71%
jan 1, 1993
14.989
-0.062
-0.41%
jan 1, 1994
16.6
+1.611
10.75%
jan 1, 1995
16.369
-0.231
-1.39%
jan 1, 1996
17.578
+1.209
7.38%
jan 1, 1997
17.836
+0.258
1.47%
jan 1, 1998
18.681
+0.845
4.74%
jan 1, 1999
19.701
+1.02
5.46%
jan 1, 2000
18.461
-1.24
-6.3%
jan 1, 2001
18.373
-0.088
-0.48%
jan 1, 2002
18.511
+0.139
0.76%
jan 1, 2003
17.227
-1.284
-6.94%
jan 1, 2004
14.751
-2.476
-14.37%
jan 1, 2005
16.381
+1.63
11.05%
jan 1, 2006
17.258
+0.877
5.35%
jan 1, 2007
17.379
+0.121
0.7%
jan 1, 2008
15.305
-2.074
-11.94%
jan 1, 2009
15.61
+0.305
1.99%
jan 1, 2010
17.612
+2.002
12.82%
jan 1, 2011
17.178
-0.433
-2.46%
jan 1, 2012
8.091
-9.088
-52.9%
jan 1, 2013
3.192
-4.899
-60.55%
jan 1, 2014
2.977
-0.215
-6.73%
jan 1, 2015
2.776
-0.201
-6.76%
Ranking of countries by current statistics by years


Comments: