29
/
en
AIzaSyAYiBZKx7MnpbEhh9jyipgxe19OcubqV5w
April 1, 2024
49803
Middle East & North Africa (IDA & IBRD countries)
TMN
false
2
1
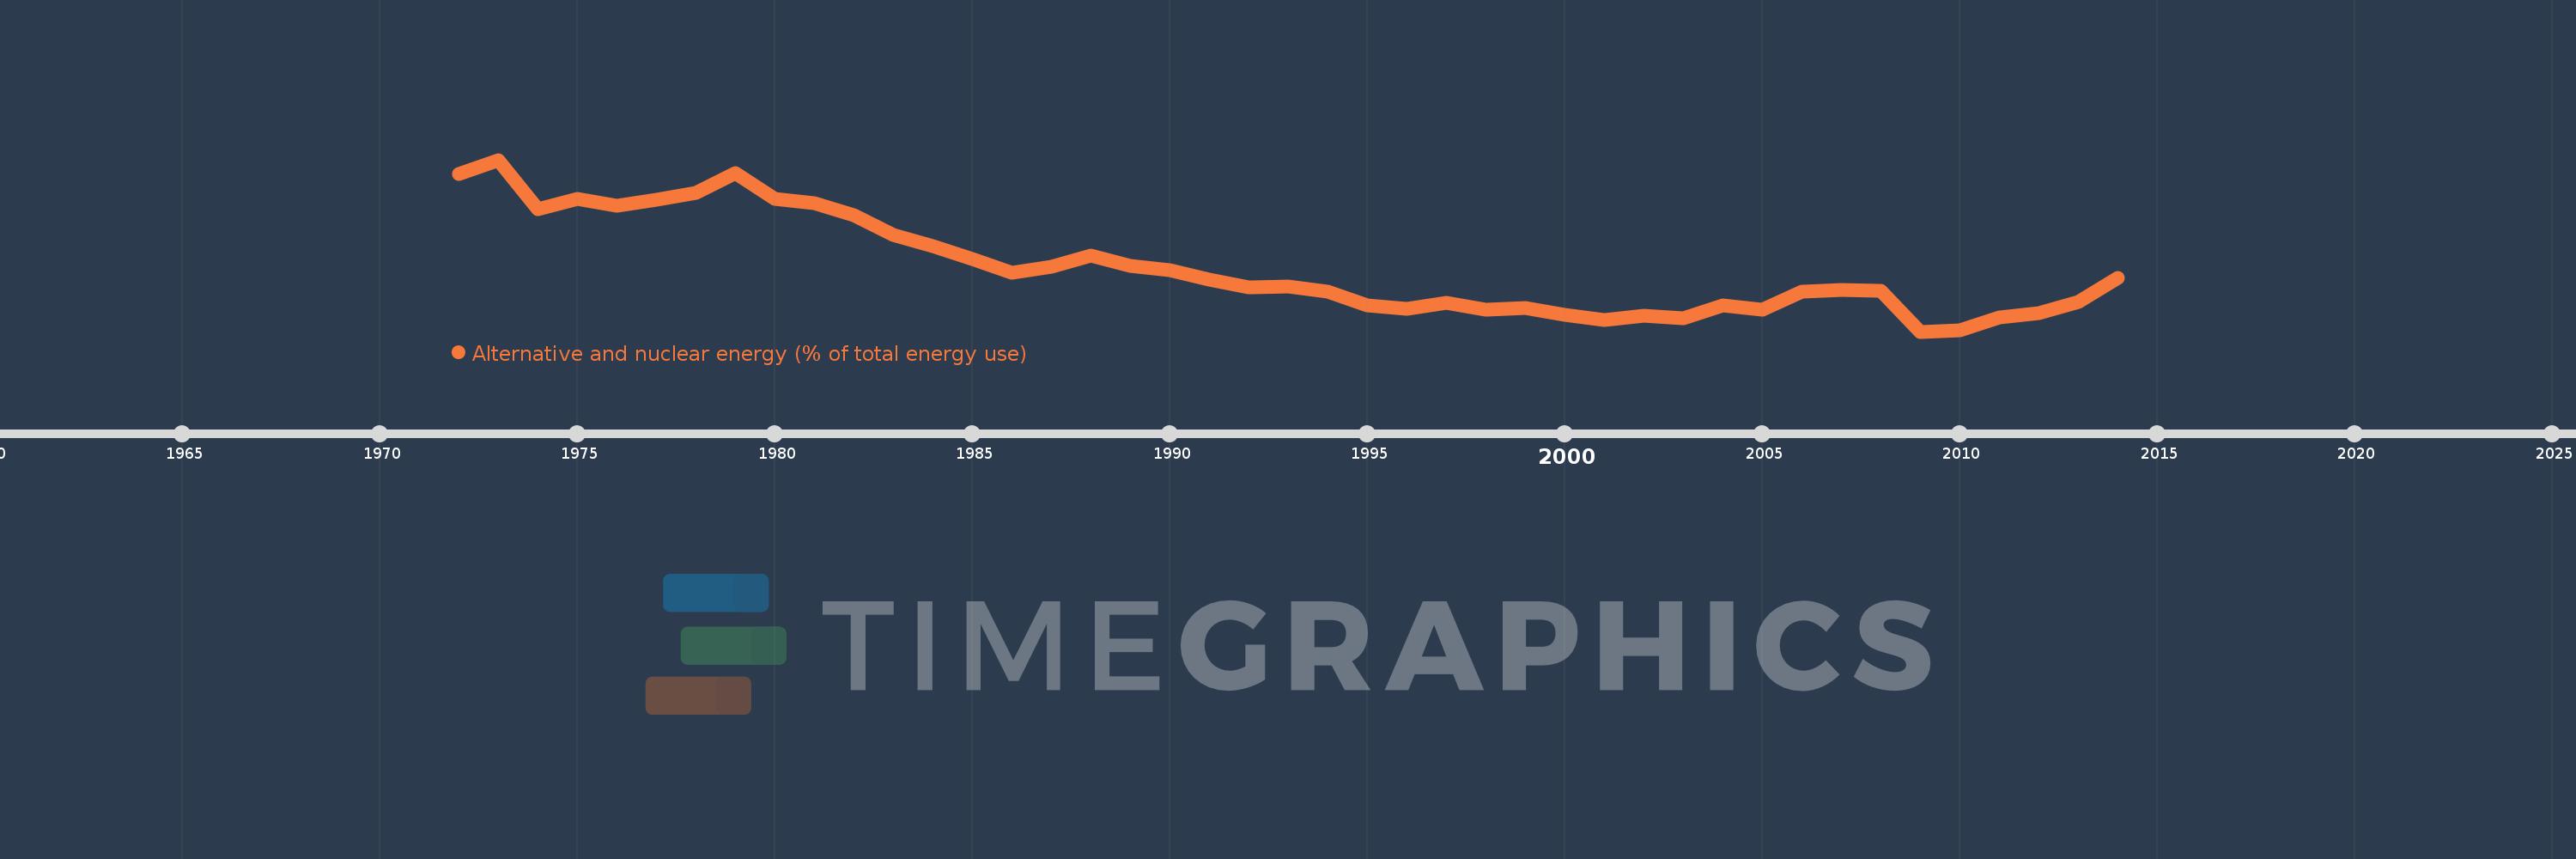
Alternative and nuclear energy (% of total energy use)
2014,2013,2012,2011,2010,2009,2008,2007,2006,2005,2004,2003,2002,2001,2000,1999,1998,1997,1996,1995,1994,1993,1992,1991,1990,1989,1988,1987,1986,1985,1984,1983,1982,1981,1980,1979,1978,1977,1976,1975,1974,1973,1972
This statistics in other country:
AlbaniaAlgeriaAngolaArab WorldArgentinaArmeniaAustraliaAustriaAzerbaijanBahrainBangladeshBelarusBelgiumBeninBoliviaBosnia and HerzegovinaBotswanaBrazilBrunei DarussalamBulgariaCambodiaCameroonCanadaCaribbean small statesCentral Europe and the BalticsChileChinaColombiaCongo, Dem. Rep.Congo, Rep.Costa RicaCote d'IvoireCroatiaCubaCuracaoCyprusCzech RepublicDenmarkDominican RepublicEarly-demographic dividendEast Asia & PacificEast Asia & Pacific (excluding high income)East Asia & Pacific (IDA & IBRD countries)EcuadorEgypt, Arab Rep.El SalvadorEritreaEstoniaEthiopiaEuro areaEurope & Central AsiaEurope & Central Asia (excluding high income)Europe & Central Asia (IDA & IBRD countries)European UnionFinlandFragile and conflict affected situationsFranceGabonGeorgiaGermanyGhanaGibraltarGreeceGuatemalaHaitiHeavily indebted poor countries (HIPC)High incomeHondurasHong Kong SAR, ChinaHungaryIBRD onlyIcelandIDA & IBRD totalIDA blendIDA onlyIDA totalIndiaIndonesiaIran, Islamic Rep.IraqIrelandIsraelItalyJamaicaJapanJordanKazakhstanKenyaKorea, Dem. People’s Rep.Korea, Rep.KosovoKuwaitKyrgyz RepublicLate-demographic dividendLatin America & Caribbean Latin America & Caribbean (excluding high income)Latin America & the Caribbean (IDA & IBRD countries)LatviaLeast developed countries: UN classificationLebanonLibyaLithuaniaLow & middle incomeLow incomeLower middle incomeLuxembourgMacedonia, FYRMalaysiaMaltaMauritiusMexicoMiddle East & North AfricaMiddle East & North Africa (excluding high income)Middle East & North Africa (IDA & IBRD countries)Middle incomeMoldovaMongoliaMontenegroMoroccoMozambiqueMyanmarNamibiaNepalNetherlandsNew ZealandNicaraguaNigerNigeriaNorth AmericaNorwayOECD membersOmanOther small statesPakistanPanamaParaguayPeruPhilippinesPolandPortugalPost-demographic dividendPre-demographic dividendQatarRomaniaRussian FederationSaudi ArabiaSenegalSerbiaSingaporeSlovak RepublicSloveniaSmall statesSouth AfricaSouth AsiaSouth Asia (IDA & IBRD)South SudanSpainSri LankaSub-Saharan Africa Sub-Saharan Africa (excluding high income)Sub-Saharan Africa (IDA & IBRD countries)SudanSwedenSwitzerlandSyrian Arab RepublicTajikistanTanzaniaThailandTogoTrinidad and TobagoTunisiaTurkeyTurkmenistanUkraineUnited Arab EmiratesUnited KingdomUnited StatesUpper middle incomeUruguayUzbekistanVenezuela, RBVietnamWorldYemen, Rep.ZambiaZimbabwe Timeline:
This timeline shows a graph from 1972 to 2014 of Middle East & North Africa (IDA & IBRD countries). No data until 1971. Number of actual observations by date: 43.
Source name:
World Development Indicators
Source organization:
IEA Statistics © OECD/IEA 2014 (http://www.iea.org/stats/index.asp), subject to https://www.iea.org/t&c/termsandconditions/
Categories, topics:
Energy & Mining
Last updated:
apr 23, 2017
Indicators value changes by year
At the date of observation
Value
Absolute change
Change from previous value
jan 1, 1972
2.116
+2.116
0.0%
jan 1, 1973
2.254
+0.138
6.52%
jan 1, 1974
1.78
-0.474
-21.02%
jan 1, 1975
1.883
+0.103
5.79%
jan 1, 1976
1.816
-0.067
-3.58%
jan 1, 1977
1.872
+0.056
3.1%
jan 1, 1978
1.936
+0.064
3.42%
jan 1, 1979
2.13
+0.194
10.01%
jan 1, 1980
1.878
-0.252
-11.85%
jan 1, 1981
1.843
-0.034
-1.83%
jan 1, 1982
1.727
-0.116
-6.31%
jan 1, 1983
1.537
-0.19
-10.98%
jan 1, 1984
1.43
-0.107
-6.98%
jan 1, 1985
1.309
-0.121
-8.44%
jan 1, 1986
1.178
-0.131
-10.04%
jan 1, 1987
1.231
+0.053
4.5%
jan 1, 1988
1.344
+0.113
9.21%
jan 1, 1989
1.238
-0.106
-7.92%
jan 1, 1990
1.197
-0.041
-3.33%
jan 1, 1991
1.11
-0.087
-7.24%
jan 1, 1992
1.04
-0.069
-6.26%
jan 1, 1993
1.043
+0.002
0.21%
jan 1, 1994
0.992
-0.05
-4.83%
jan 1, 1995
0.868
-0.124
-12.51%
jan 1, 1996
0.836
-0.032
-3.72%
jan 1, 1997
0.893
+0.057
6.83%
jan 1, 1998
0.823
-0.07
-7.83%
jan 1, 1999
0.84
+0.017
2.02%
jan 1, 2000
0.773
-0.066
-7.89%
jan 1, 2001
0.722
-0.051
-6.66%
jan 1, 2002
0.765
+0.043
5.98%
jan 1, 2003
0.743
-0.022
-2.84%
jan 1, 2004
0.864
+0.121
16.28%
jan 1, 2005
0.823
-0.042
-4.82%
jan 1, 2006
1.0
+0.177
21.51%
jan 1, 2007
1.014
+0.015
1.46%
jan 1, 2008
1.003
-0.012
-1.15%
jan 1, 2009
0.615
-0.387
-38.61%
jan 1, 2010
0.626
+0.01
1.64%
jan 1, 2011
0.75
+0.125
19.95%
jan 1, 2012
0.793
+0.043
5.7%
jan 1, 2013
0.897
+0.104
13.12%
jan 1, 2014
1.13
+0.233
25.94%
Ranking of countries by current statistics by years


Comments: