29
/
en
AIzaSyAYiBZKx7MnpbEhh9jyipgxe19OcubqV5w
April 1, 2024
72528
Aruba
ABW
true
2
1
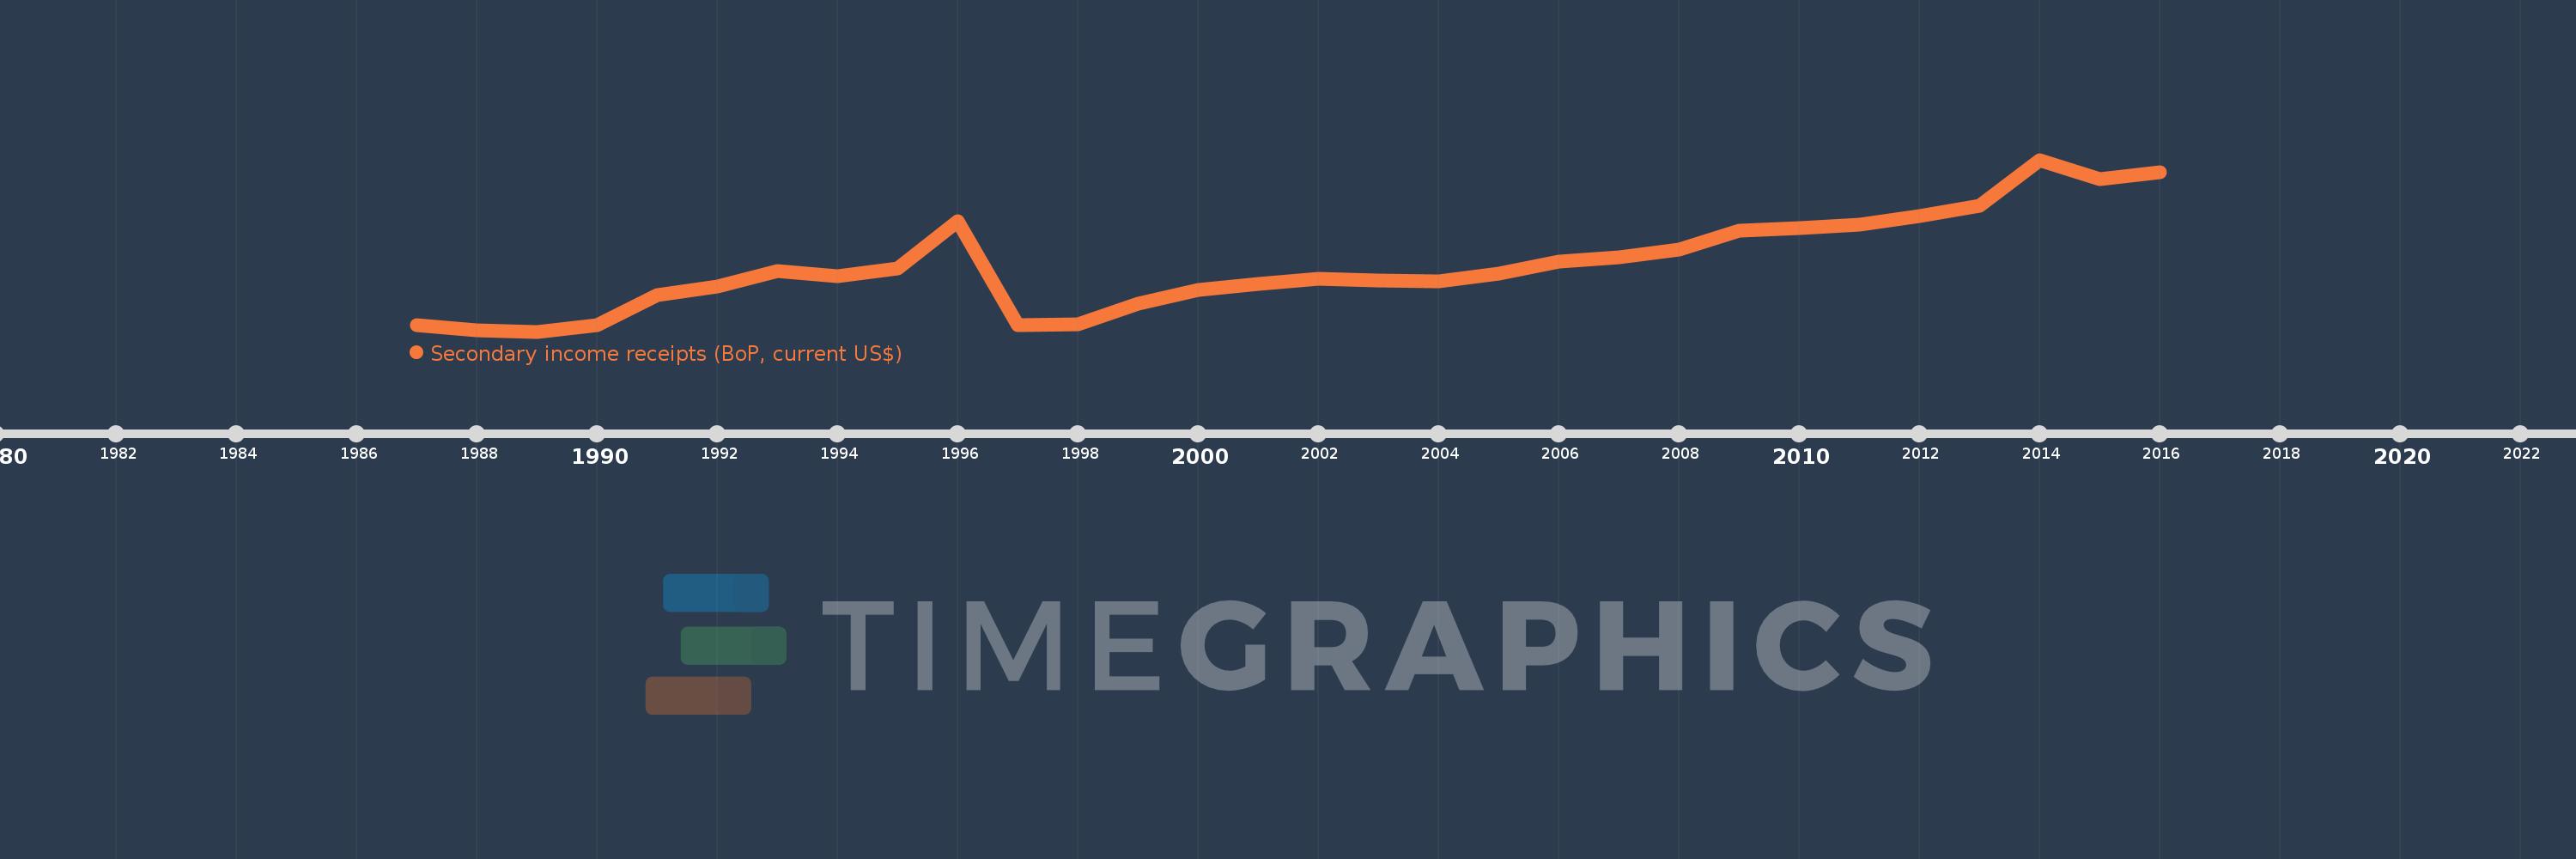
Secondary income receipts (BoP, current US$)
2016,2015,2014,2013,2012,2011,2010,2009,2008,2007,2006,2005,2004,2003,2002,2001,2000,1999,1998,1997,1996,1995,1994,1993,1992,1991,1990,1989,1988,1987
This statistics in other country:
AfghanistanAlbaniaAlgeriaAngolaAntigua and BarbudaArab WorldArgentinaArmeniaArubaAustraliaAustriaAzerbaijanBahamas, TheBahrainBangladeshBarbadosBelarusBelgiumBelizeBeninBermudaBhutanBoliviaBosnia and HerzegovinaBotswanaBrazilBrunei DarussalamBulgariaBurkina FasoBurundiCabo VerdeCambodiaCameroonCanadaCaribbean small statesCentral African RepublicCentral Europe and the BalticsChadChileChinaColombiaComorosCongo, Dem. Rep.Congo, Rep.Costa RicaCote d'IvoireCroatiaCuracaoCyprusCzech RepublicDenmarkDjiboutiDominicaDominican RepublicEarly-demographic dividendEast Asia & PacificEast Asia & Pacific (excluding high income)East Asia & Pacific (IDA & IBRD countries)EcuadorEgypt, Arab Rep.El SalvadorEquatorial GuineaEritreaEstoniaEthiopiaEuro areaEurope & Central AsiaEurope & Central Asia (excluding high income)Europe & Central Asia (IDA & IBRD countries)European UnionFaroe IslandsFijiFinlandFragile and conflict affected situationsFranceFrench PolynesiaGabonGambia, TheGeorgiaGermanyGhanaGreeceGrenadaGuatemalaGuineaGuinea-BissauGuyanaHaitiHeavily indebted poor countries (HIPC)High incomeHondurasHong Kong SAR, ChinaHungaryIBRD onlyIcelandIDA & IBRD totalIDA blendIDA onlyIDA totalIndiaIndonesiaIran, Islamic Rep.IraqIrelandIsraelItalyJamaicaJapanJordanKazakhstanKenyaKiribatiKorea, Rep.KosovoKuwaitKyrgyz RepublicLao PDRLate-demographic dividendLatin America & Caribbean Latin America & Caribbean (excluding high income)Latin America & the Caribbean (IDA & IBRD countries)LatviaLeast developed countries: UN classificationLebanonLesothoLiberiaLibyaLithuaniaLow & middle incomeLow incomeLower middle incomeLuxembourgMacao SAR, ChinaMacedonia, FYRMadagascarMalawiMalaysiaMaldivesMaliMaltaMarshall IslandsMauritaniaMauritiusMexicoMicronesia, Fed. Sts.Middle East & North AfricaMiddle East & North Africa (excluding high income)Middle East & North Africa (IDA & IBRD countries)Middle incomeMoldovaMongoliaMontenegroMoroccoMozambiqueMyanmarNamibiaNepalNetherlandsNew CaledoniaNew ZealandNicaraguaNigerNigeriaNorth AmericaNorwayOECD membersOmanOther small statesPacific island small statesPakistanPalauPanamaPapua New GuineaParaguayPeruPhilippinesPolandPortugalPost-demographic dividendPre-demographic dividendQatarRomaniaRussian FederationRwandaSamoaSao Tome and PrincipeSaudi ArabiaSenegalSerbiaSeychellesSierra LeoneSingaporeSint Maarten (Dutch part)Slovak RepublicSloveniaSmall statesSolomon IslandsSouth AfricaSouth AsiaSouth Asia (IDA & IBRD)South SudanSpainSri LankaSt. Kitts and NevisSt. LuciaSt. Vincent and the GrenadinesSub-Saharan Africa Sub-Saharan Africa (excluding high income)Sub-Saharan Africa (IDA & IBRD countries)SudanSurinameSwazilandSwedenSwitzerlandSyrian Arab RepublicTajikistanTanzaniaThailandTimor-LesteTogoTongaTrinidad and TobagoTunisiaTurkeyTuvaluUgandaUkraineUnited KingdomUnited StatesUpper middle incomeUruguayVanuatuVenezuela, RBVietnamWest Bank and GazaWorldYemen, Rep.ZambiaZimbabwe Timeline:
This timeline shows a graph from 1987 to 2016 of Aruba. No data until 1986. Number of actual observations by date: 30.
Source name:
World Development Indicators
Source organization:
International Monetary Fund, Balance of Payments Statistics Yearbook and data files.
Categories, topics:
Economy & Growth
Last updated:
apr 23, 2017
Indicators value changes by year
Minimum:
14.86 mln
jan 1, 1989
Maximum:
103.184 mln
jan 1, 2014
At the date of observation
Value
Absolute change
Change from previous value
jan 1, 1987
18.38 mln
+18.38 mln
0.0%
jan 1, 1988
15.419 mln
-2.961 mln
-16.11%
jan 1, 1989
14.86 mln
-558.659K
-3.62%
jan 1, 1990
17.989 mln
+3.128 mln
21.05%
jan 1, 1991
33.799 mln
+15.81 mln
87.89%
jan 1, 1992
38.101 mln
+4.302 mln
12.73%
jan 1, 1993
45.922 mln
+7.821 mln
20.53%
jan 1, 1994
43.408 mln
-2.514 mln
-5.47%
jan 1, 1995
47.486 mln
+4.078 mln
9.4%
jan 1, 1996
71.453 mln
+23.966 mln
50.47%
jan 1, 1997
18.38 mln
-53.073 mln
-74.28%
jan 1, 1998
18.436 mln
+55.866K
0.3%
jan 1, 1999
29.274 mln
+10.838 mln
58.79%
jan 1, 2000
36.313 mln
+7.039 mln
24.05%
jan 1, 2001
39.453 mln
+3.14 mln
8.65%
jan 1, 2002
42.067 mln
+2.615 mln
6.63%
jan 1, 2003
40.955 mln
-1.112 mln
-2.64%
jan 1, 2004
40.782 mln
-173.184K
-0.42%
jan 1, 2005
44.749 mln
+3.966 mln
9.73%
jan 1, 2006
50.974 mln
+6.226 mln
13.91%
jan 1, 2007
53.228 mln
+2.254 mln
4.42%
jan 1, 2008
56.816 mln
+3.588 mln
6.74%
jan 1, 2009
66.592 mln
+9.777 mln
17.21%
jan 1, 2010
67.877 mln
+1.285 mln
1.93%
jan 1, 2011
69.944 mln
+2.067 mln
3.05%
jan 1, 2012
74.19 mln
+4.246 mln
6.07%
jan 1, 2013
79.441 mln
+5.251 mln
7.08%
jan 1, 2014
103.184 mln
+23.743 mln
29.89%
jan 1, 2015
93.073 mln
-10.112 mln
-9.8%
jan 1, 2016
96.648 mln
+3.575 mln
3.84%
Ranking of countries by current statistics by years


Comments: