29
/
en
AIzaSyAYiBZKx7MnpbEhh9jyipgxe19OcubqV5w
April 1, 2024
41070
Late-demographic dividend
LTE
false
2
1
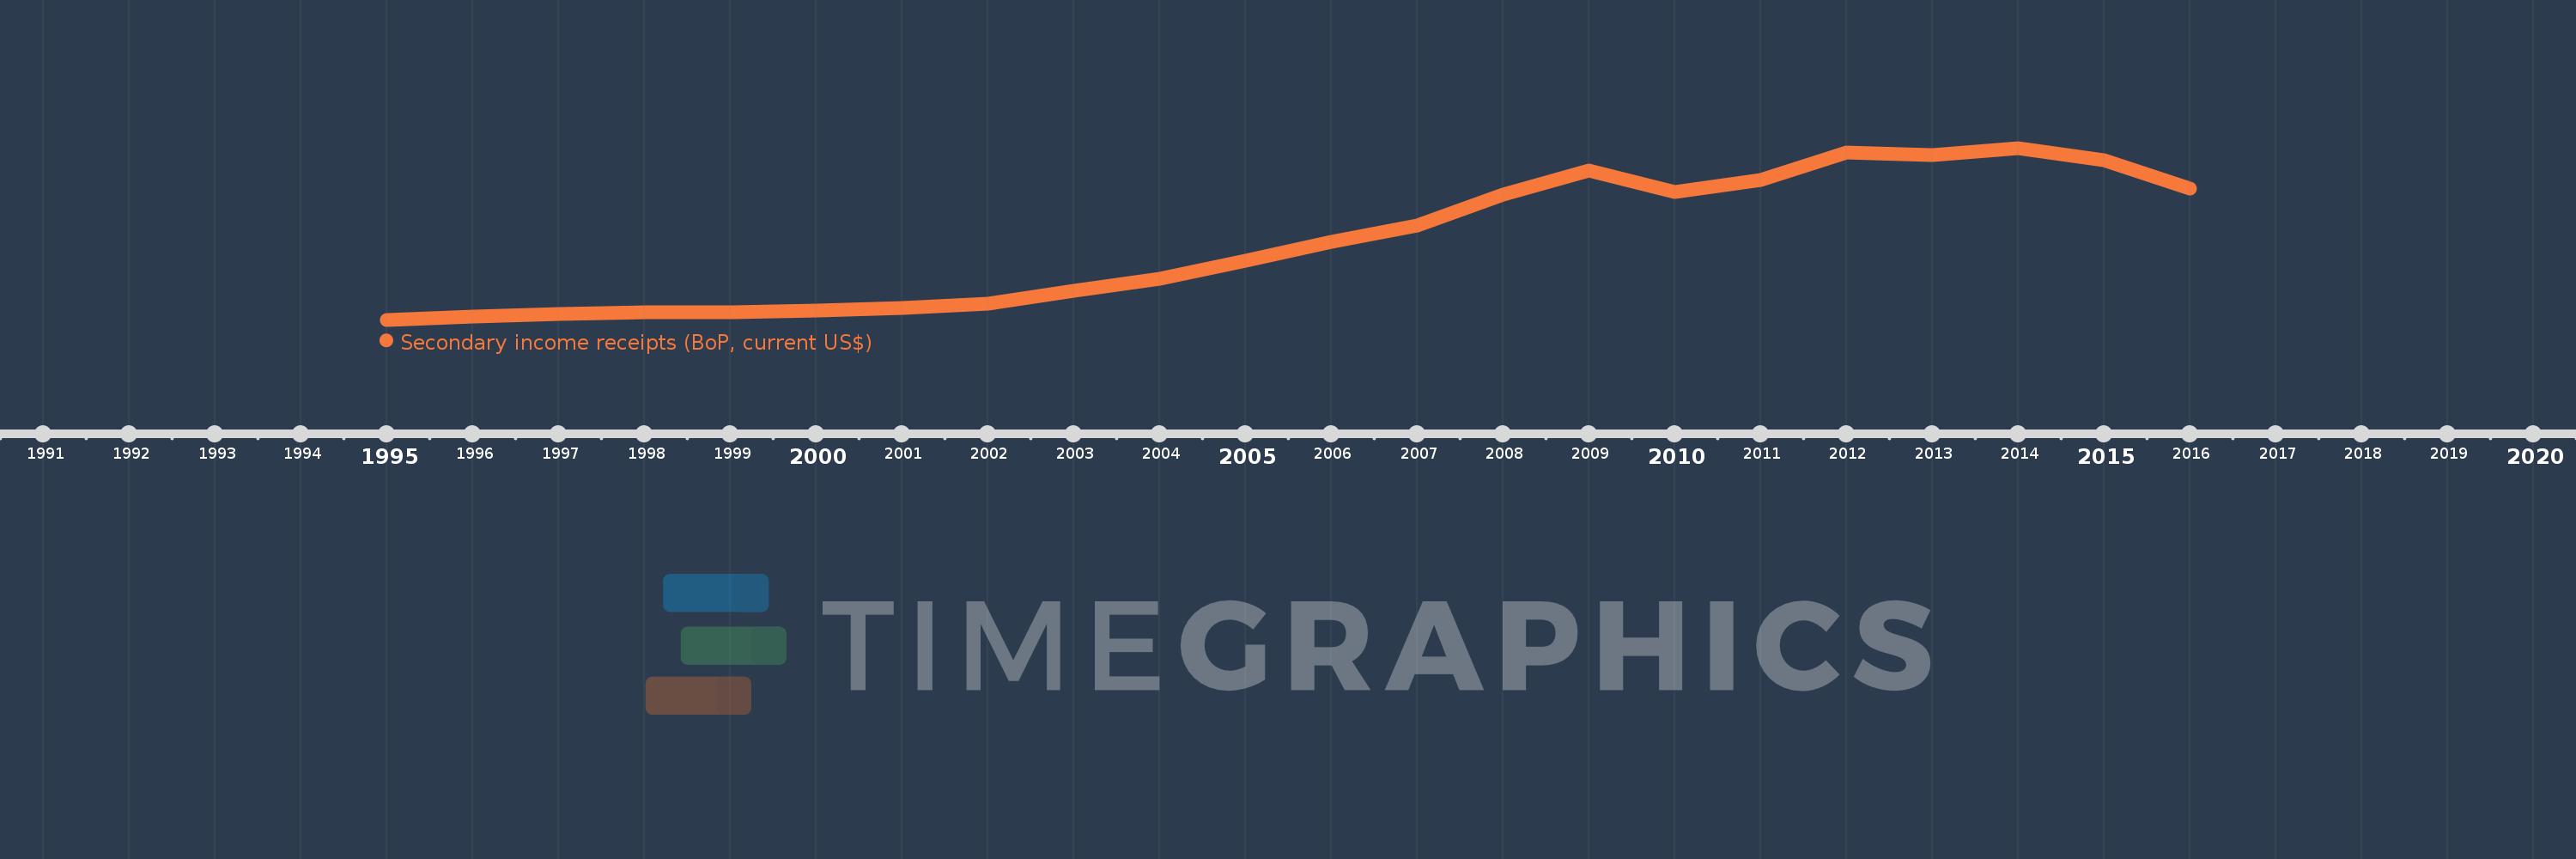
Secondary income receipts (BoP, current US$)
2016,2015,2014,2013,2012,2011,2010,2009,2008,2007,2006,2005,2004,2003,2002,2001,2000,1999,1998,1997,1996,1995
This statistics in other country:
AfghanistanAlbaniaAlgeriaAngolaAntigua and BarbudaArab WorldArgentinaArmeniaArubaAustraliaAustriaAzerbaijanBahamas, TheBahrainBangladeshBarbadosBelarusBelgiumBelizeBeninBermudaBhutanBoliviaBosnia and HerzegovinaBotswanaBrazilBrunei DarussalamBulgariaBurkina FasoBurundiCabo VerdeCambodiaCameroonCanadaCaribbean small statesCentral African RepublicCentral Europe and the BalticsChadChileChinaColombiaComorosCongo, Dem. Rep.Congo, Rep.Costa RicaCote d'IvoireCroatiaCuracaoCyprusCzech RepublicDenmarkDjiboutiDominicaDominican RepublicEarly-demographic dividendEast Asia & PacificEast Asia & Pacific (excluding high income)East Asia & Pacific (IDA & IBRD countries)EcuadorEgypt, Arab Rep.El SalvadorEquatorial GuineaEritreaEstoniaEthiopiaEuro areaEurope & Central AsiaEurope & Central Asia (excluding high income)Europe & Central Asia (IDA & IBRD countries)European UnionFaroe IslandsFijiFinlandFragile and conflict affected situationsFranceFrench PolynesiaGabonGambia, TheGeorgiaGermanyGhanaGreeceGrenadaGuatemalaGuineaGuinea-BissauGuyanaHaitiHeavily indebted poor countries (HIPC)High incomeHondurasHong Kong SAR, ChinaHungaryIBRD onlyIcelandIDA & IBRD totalIDA blendIDA onlyIDA totalIndiaIndonesiaIran, Islamic Rep.IraqIrelandIsraelItalyJamaicaJapanJordanKazakhstanKenyaKiribatiKorea, Rep.KosovoKuwaitKyrgyz RepublicLao PDRLate-demographic dividendLatin America & Caribbean Latin America & Caribbean (excluding high income)Latin America & the Caribbean (IDA & IBRD countries)LatviaLeast developed countries: UN classificationLebanonLesothoLiberiaLibyaLithuaniaLow & middle incomeLow incomeLower middle incomeLuxembourgMacao SAR, ChinaMacedonia, FYRMadagascarMalawiMalaysiaMaldivesMaliMaltaMarshall IslandsMauritaniaMauritiusMexicoMicronesia, Fed. Sts.Middle East & North AfricaMiddle East & North Africa (excluding high income)Middle East & North Africa (IDA & IBRD countries)Middle incomeMoldovaMongoliaMontenegroMoroccoMozambiqueMyanmarNamibiaNepalNetherlandsNew CaledoniaNew ZealandNicaraguaNigerNigeriaNorth AmericaNorwayOECD membersOmanOther small statesPacific island small statesPakistanPalauPanamaPapua New GuineaParaguayPeruPhilippinesPolandPortugalPost-demographic dividendPre-demographic dividendQatarRomaniaRussian FederationRwandaSamoaSao Tome and PrincipeSaudi ArabiaSenegalSerbiaSeychellesSierra LeoneSingaporeSint Maarten (Dutch part)Slovak RepublicSloveniaSmall statesSolomon IslandsSouth AfricaSouth AsiaSouth Asia (IDA & IBRD)South SudanSpainSri LankaSt. Kitts and NevisSt. LuciaSt. Vincent and the GrenadinesSub-Saharan Africa Sub-Saharan Africa (excluding high income)Sub-Saharan Africa (IDA & IBRD countries)SudanSurinameSwazilandSwedenSwitzerlandSyrian Arab RepublicTajikistanTanzaniaThailandTimor-LesteTogoTongaTrinidad and TobagoTunisiaTurkeyTuvaluUgandaUkraineUnited KingdomUnited StatesUpper middle incomeUruguayVanuatuVenezuela, RBVietnamWest Bank and GazaWorldYemen, Rep.ZambiaZimbabwe Timeline:
This timeline shows a graph from 1995 to 2016 of Late-demographic dividend. No data until 1994. Number of actual observations by date: 22.
Source name:
World Development Indicators
Source organization:
International Monetary Fund, Balance of Payments Statistics Yearbook and data files.
Categories, topics:
Economy & Growth
Last updated:
apr 23, 2017
Indicators value changes by year
Minimum:
17.251 bln
jan 1, 1995
Maximum:
191.208 bln
jan 1, 2014
At the date of observation
Value
Absolute change
Change from previous value
jan 1, 1995
17.251 bln
+17.251 bln
0.0%
jan 1, 1996
20.147 bln
+2.896 bln
16.79%
jan 1, 1997
22.919 bln
+2.772 bln
13.76%
jan 1, 1998
24.615 bln
+1.696 bln
7.4%
jan 1, 1999
24.422 bln
-192.631 mln
-0.78%
jan 1, 2000
26.528 bln
+2.106 bln
8.62%
jan 1, 2001
28.969 bln
+2.441 bln
9.2%
jan 1, 2002
33.423 bln
+4.453 bln
15.37%
jan 1, 2003
46.195 bln
+12.772 bln
38.21%
jan 1, 2004
59.109 bln
+12.914 bln
27.95%
jan 1, 2005
76.66 bln
+17.551 bln
29.69%
jan 1, 2006
96.073 bln
+19.413 bln
25.32%
jan 1, 2007
113.011 bln
+16.938 bln
17.63%
jan 1, 2008
143.827 bln
+30.816 bln
27.27%
jan 1, 2009
168.536 bln
+24.709 bln
17.18%
jan 1, 2010
146.302 bln
-22.233 bln
-13.19%
jan 1, 2011
159.056 bln
+12.754 bln
8.72%
jan 1, 2012
186.305 bln
+27.249 bln
17.13%
jan 1, 2013
184.163 bln
-2.142 bln
-1.15%
jan 1, 2014
191.208 bln
+7.045 bln
3.83%
jan 1, 2015
179.18 bln
-12.028 bln
-6.29%
jan 1, 2016
150.19 bln
-28.99 bln
-16.18%
Ranking of countries by current statistics by years


Comments: