29
/
en
AIzaSyAYiBZKx7MnpbEhh9jyipgxe19OcubqV5w
April 1, 2024
276155
United Kingdom
GBR
true
2
1
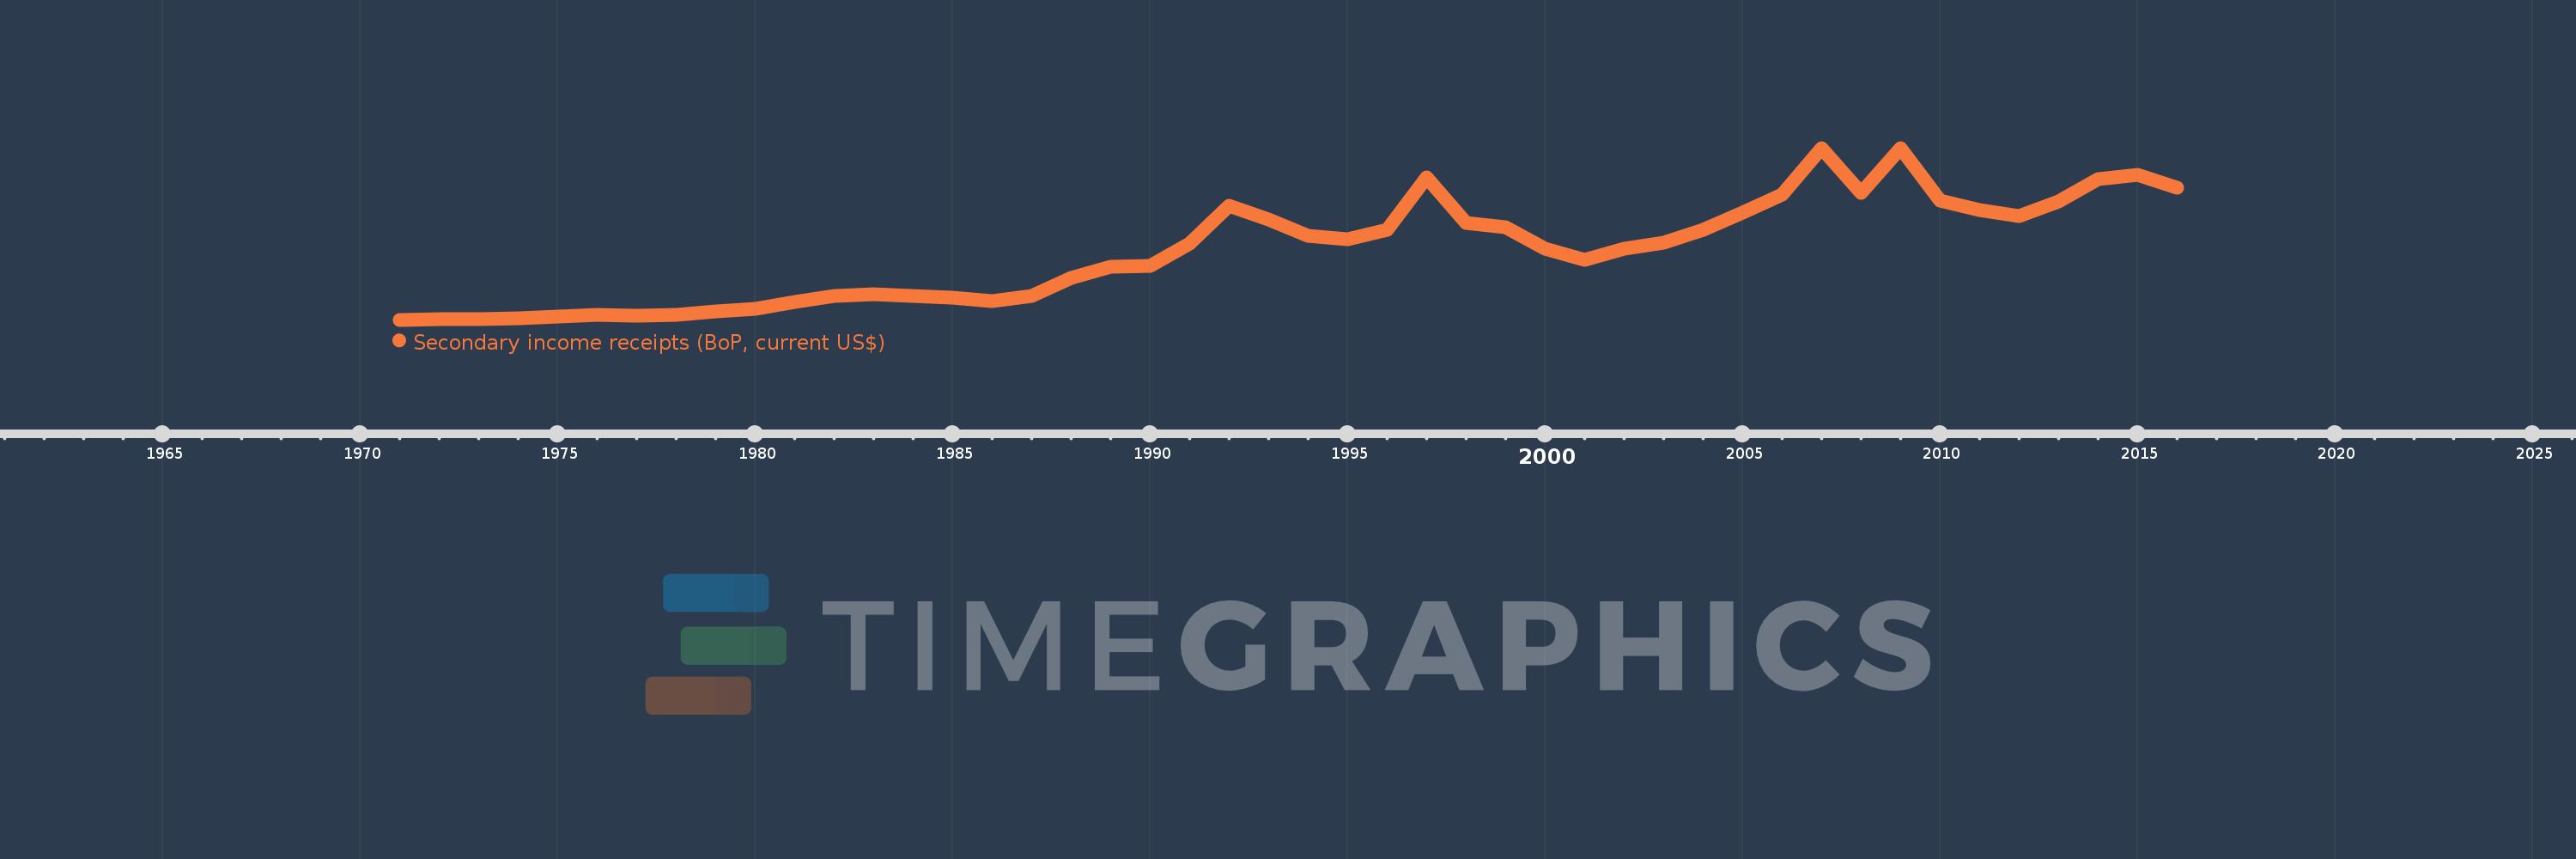
Secondary income receipts (BoP, current US$)
2016,2015,2014,2013,2012,2011,2010,2009,2008,2007,2006,2005,2004,2003,2002,2001,2000,1999,1998,1997,1996,1995,1994,1993,1992,1991,1990,1989,1988,1987,1986,1985,1984,1983,1982,1981,1980,1979,1978,1977,1976,1975,1974,1973,1972,1971
This statistics in other country:
AfghanistanAlbaniaAlgeriaAngolaAntigua and BarbudaArab WorldArgentinaArmeniaArubaAustraliaAustriaAzerbaijanBahamas, TheBahrainBangladeshBarbadosBelarusBelgiumBelizeBeninBermudaBhutanBoliviaBosnia and HerzegovinaBotswanaBrazilBrunei DarussalamBulgariaBurkina FasoBurundiCabo VerdeCambodiaCameroonCanadaCaribbean small statesCentral African RepublicCentral Europe and the BalticsChadChileChinaColombiaComorosCongo, Dem. Rep.Congo, Rep.Costa RicaCote d'IvoireCroatiaCuracaoCyprusCzech RepublicDenmarkDjiboutiDominicaDominican RepublicEarly-demographic dividendEast Asia & PacificEast Asia & Pacific (excluding high income)East Asia & Pacific (IDA & IBRD countries)EcuadorEgypt, Arab Rep.El SalvadorEquatorial GuineaEritreaEstoniaEthiopiaEuro areaEurope & Central AsiaEurope & Central Asia (excluding high income)Europe & Central Asia (IDA & IBRD countries)European UnionFaroe IslandsFijiFinlandFragile and conflict affected situationsFranceFrench PolynesiaGabonGambia, TheGeorgiaGermanyGhanaGreeceGrenadaGuatemalaGuineaGuinea-BissauGuyanaHaitiHeavily indebted poor countries (HIPC)High incomeHondurasHong Kong SAR, ChinaHungaryIBRD onlyIcelandIDA & IBRD totalIDA blendIDA onlyIDA totalIndiaIndonesiaIran, Islamic Rep.IraqIrelandIsraelItalyJamaicaJapanJordanKazakhstanKenyaKiribatiKorea, Rep.KosovoKuwaitKyrgyz RepublicLao PDRLate-demographic dividendLatin America & Caribbean Latin America & Caribbean (excluding high income)Latin America & the Caribbean (IDA & IBRD countries)LatviaLeast developed countries: UN classificationLebanonLesothoLiberiaLibyaLithuaniaLow & middle incomeLow incomeLower middle incomeLuxembourgMacao SAR, ChinaMacedonia, FYRMadagascarMalawiMalaysiaMaldivesMaliMaltaMarshall IslandsMauritaniaMauritiusMexicoMicronesia, Fed. Sts.Middle East & North AfricaMiddle East & North Africa (excluding high income)Middle East & North Africa (IDA & IBRD countries)Middle incomeMoldovaMongoliaMontenegroMoroccoMozambiqueMyanmarNamibiaNepalNetherlandsNew CaledoniaNew ZealandNicaraguaNigerNigeriaNorth AmericaNorwayOECD membersOmanOther small statesPacific island small statesPakistanPalauPanamaPapua New GuineaParaguayPeruPhilippinesPolandPortugalPost-demographic dividendPre-demographic dividendQatarRomaniaRussian FederationRwandaSamoaSao Tome and PrincipeSaudi ArabiaSenegalSerbiaSeychellesSierra LeoneSingaporeSint Maarten (Dutch part)Slovak RepublicSloveniaSmall statesSolomon IslandsSouth AfricaSouth AsiaSouth Asia (IDA & IBRD)South SudanSpainSri LankaSt. Kitts and NevisSt. LuciaSt. Vincent and the GrenadinesSub-Saharan Africa Sub-Saharan Africa (excluding high income)Sub-Saharan Africa (IDA & IBRD countries)SudanSurinameSwazilandSwedenSwitzerlandSyrian Arab RepublicTajikistanTanzaniaThailandTimor-LesteTogoTongaTrinidad and TobagoTunisiaTurkeyTuvaluUgandaUkraineUnited KingdomUnited StatesUpper middle incomeUruguayVanuatuVenezuela, RBVietnamWest Bank and GazaWorldYemen, Rep.ZambiaZimbabwe Timeline:
This timeline shows a graph from 1971 to 2016 of United Kingdom. No data until 1970. Number of actual observations by date: 46.
Source name:
World Development Indicators
Source organization:
International Monetary Fund, Balance of Payments Statistics Yearbook and data files.
Categories, topics:
Economy & Growth
Last updated:
apr 23, 2017
Indicators value changes by year
Minimum:
552.0 mln
jan 1, 1971
Maximum:
37.446 bln
jan 1, 2009
At the date of observation
Value
Absolute change
Change from previous value
jan 1, 1971
552.0 mln
+552.0 mln
0.0%
jan 1, 1972
599.108 mln
+47.109 mln
8.53%
jan 1, 1973
659.828 mln
+60.72 mln
10.14%
jan 1, 1974
947.193 mln
+287.365 mln
43.55%
jan 1, 1975
1.143 bln
+195.98 mln
20.69%
jan 1, 1976
1.684 bln
+541.004 mln
47.32%
jan 1, 1977
1.42 bln
-264.124 mln
-15.68%
jan 1, 1978
1.594 bln
+173.685 mln
12.23%
jan 1, 1979
2.33 bln
+736.364 mln
46.2%
jan 1, 1980
2.976 bln
+646.124 mln
27.73%
jan 1, 1981
4.414 bln
+1.437 bln
48.29%
jan 1, 1982
5.751 bln
+1.337 bln
30.3%
jan 1, 1983
5.996 bln
+244.963 mln
4.26%
jan 1, 1984
5.699 bln
-296.452 mln
-4.94%
jan 1, 1985
5.337 bln
-362.342 mln
-6.36%
jan 1, 1986
4.573 bln
-763.703 mln
-14.31%
jan 1, 1987
5.676 bln
+1.102 bln
24.11%
jan 1, 1988
9.584 bln
+3.908 bln
68.86%
jan 1, 1989
11.96 bln
+2.376 bln
24.79%
jan 1, 1990
12.096 bln
+135.832 mln
1.14%
jan 1, 1991
16.87 bln
+4.774 bln
39.46%
jan 1, 1992
25.085 bln
+8.215 bln
48.7%
jan 1, 1993
22.164 bln
-2.92 bln
-11.64%
jan 1, 1994
18.664 bln
-3.501 bln
-15.79%
jan 1, 1995
17.809 bln
-855.015 mln
-4.58%
jan 1, 1996
19.808 bln
+2.0 bln
11.23%
jan 1, 1997
31.201 bln
+11.393 bln
57.52%
jan 1, 1998
21.4 bln
-9.801 bln
-31.41%
jan 1, 1999
20.471 bln
-929.288 mln
-4.34%
jan 1, 2000
15.804 bln
-4.666 bln
-22.8%
jan 1, 2001
13.318 bln
-2.486 bln
-15.73%
jan 1, 2002
15.854 bln
+2.536 bln
19.04%
jan 1, 2003
17.15 bln
+1.296 bln
8.17%
jan 1, 2004
19.803 bln
+2.654 bln
15.47%
jan 1, 2005
23.551 bln
+3.747 bln
18.92%
jan 1, 2006
27.369 bln
+3.819 bln
16.22%
jan 1, 2007
37.375 bln
+10.005 bln
36.56%
jan 1, 2008
27.721 bln
-9.654 bln
-25.83%
jan 1, 2009
37.446 bln
+9.725 bln
35.08%
jan 1, 2010
26.146 bln
-11.3 bln
-30.18%
jan 1, 2011
24.061 bln
-2.086 bln
-7.98%
jan 1, 2012
22.784 bln
-1.277 bln
-5.31%
jan 1, 2013
25.987 bln
+3.203 bln
14.06%
jan 1, 2014
30.675 bln
+4.688 bln
18.04%
jan 1, 2015
31.711 bln
+1.036 bln
3.38%
jan 1, 2016
28.973 bln
-2.738 bln
-8.63%
Ranking of countries by current statistics by years


Comments: