29
/
en
AIzaSyAYiBZKx7MnpbEhh9jyipgxe19OcubqV5w
April 1, 2024
60370
Sub-Saharan Africa (excluding high income)
SSA
false
2
1
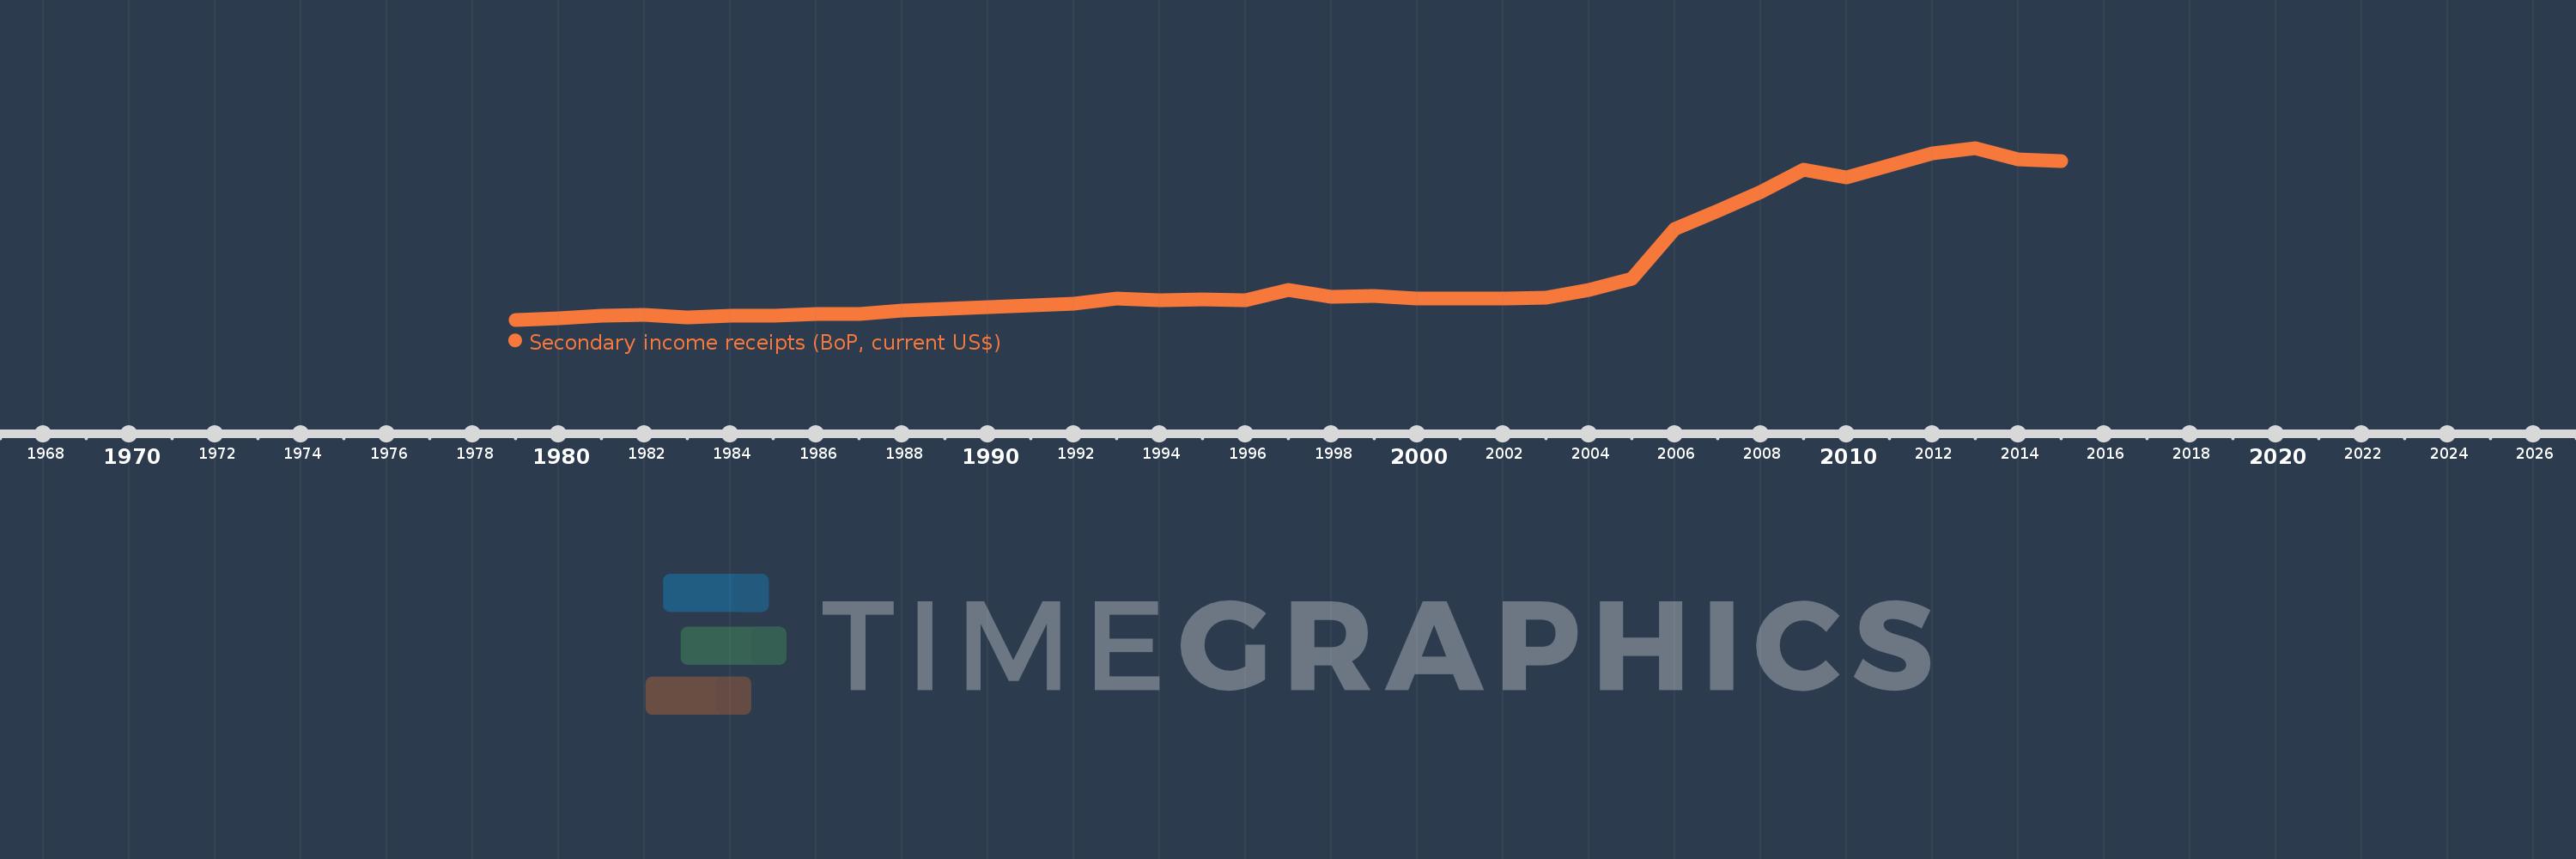
Secondary income receipts (BoP, current US$)
2015,2014,2013,2012,2011,2010,2009,2008,2007,2006,2005,2004,2003,2002,2001,2000,1999,1998,1997,1996,1995,1994,1993,1992,1991,1990,1989,1988,1987,1986,1985,1984,1983,1982,1981,1980,1979
This statistics in other country:
AfghanistanAlbaniaAlgeriaAngolaAntigua and BarbudaArab WorldArgentinaArmeniaArubaAustraliaAustriaAzerbaijanBahamas, TheBahrainBangladeshBarbadosBelarusBelgiumBelizeBeninBermudaBhutanBoliviaBosnia and HerzegovinaBotswanaBrazilBrunei DarussalamBulgariaBurkina FasoBurundiCabo VerdeCambodiaCameroonCanadaCaribbean small statesCentral African RepublicCentral Europe and the BalticsChadChileChinaColombiaComorosCongo, Dem. Rep.Congo, Rep.Costa RicaCote d'IvoireCroatiaCuracaoCyprusCzech RepublicDenmarkDjiboutiDominicaDominican RepublicEarly-demographic dividendEast Asia & PacificEast Asia & Pacific (excluding high income)East Asia & Pacific (IDA & IBRD countries)EcuadorEgypt, Arab Rep.El SalvadorEquatorial GuineaEritreaEstoniaEthiopiaEuro areaEurope & Central AsiaEurope & Central Asia (excluding high income)Europe & Central Asia (IDA & IBRD countries)European UnionFaroe IslandsFijiFinlandFragile and conflict affected situationsFranceFrench PolynesiaGabonGambia, TheGeorgiaGermanyGhanaGreeceGrenadaGuatemalaGuineaGuinea-BissauGuyanaHaitiHeavily indebted poor countries (HIPC)High incomeHondurasHong Kong SAR, ChinaHungaryIBRD onlyIcelandIDA & IBRD totalIDA blendIDA onlyIDA totalIndiaIndonesiaIran, Islamic Rep.IraqIrelandIsraelItalyJamaicaJapanJordanKazakhstanKenyaKiribatiKorea, Rep.KosovoKuwaitKyrgyz RepublicLao PDRLate-demographic dividendLatin America & Caribbean Latin America & Caribbean (excluding high income)Latin America & the Caribbean (IDA & IBRD countries)LatviaLeast developed countries: UN classificationLebanonLesothoLiberiaLibyaLithuaniaLow & middle incomeLow incomeLower middle incomeLuxembourgMacao SAR, ChinaMacedonia, FYRMadagascarMalawiMalaysiaMaldivesMaliMaltaMarshall IslandsMauritaniaMauritiusMexicoMicronesia, Fed. Sts.Middle East & North AfricaMiddle East & North Africa (excluding high income)Middle East & North Africa (IDA & IBRD countries)Middle incomeMoldovaMongoliaMontenegroMoroccoMozambiqueMyanmarNamibiaNepalNetherlandsNew CaledoniaNew ZealandNicaraguaNigerNigeriaNorth AmericaNorwayOECD membersOmanOther small statesPacific island small statesPakistanPalauPanamaPapua New GuineaParaguayPeruPhilippinesPolandPortugalPost-demographic dividendPre-demographic dividendQatarRomaniaRussian FederationRwandaSamoaSao Tome and PrincipeSaudi ArabiaSenegalSerbiaSeychellesSierra LeoneSingaporeSint Maarten (Dutch part)Slovak RepublicSloveniaSmall statesSolomon IslandsSouth AfricaSouth AsiaSouth Asia (IDA & IBRD)South SudanSpainSri LankaSt. Kitts and NevisSt. LuciaSt. Vincent and the GrenadinesSub-Saharan Africa Sub-Saharan Africa (excluding high income)Sub-Saharan Africa (IDA & IBRD countries)SudanSurinameSwazilandSwedenSwitzerlandSyrian Arab RepublicTajikistanTanzaniaThailandTimor-LesteTogoTongaTrinidad and TobagoTunisiaTurkeyTuvaluUgandaUkraineUnited KingdomUnited StatesUpper middle incomeUruguayVanuatuVenezuela, RBVietnamWest Bank and GazaWorldYemen, Rep.ZambiaZimbabwe Timeline:
This timeline shows a graph from 1979 to 2015 of Sub-Saharan Africa (excluding high income). No data until 1978. Number of actual observations by date: 37.
Source name:
World Development Indicators
Source organization:
International Monetary Fund, Balance of Payments Statistics Yearbook and data files.
Categories, topics:
Economy & Growth
Last updated:
apr 23, 2017
Indicators value changes by year
Minimum:
2.598 bln
jan 1, 1979
Maximum:
62.375 bln
jan 1, 2013
At the date of observation
Value
Absolute change
Change from previous value
jan 1, 1979
2.598 bln
+2.598 bln
0.0%
jan 1, 1980
3.065 bln
+467.54 mln
18.0%
jan 1, 1981
3.926 bln
+860.446 mln
28.07%
jan 1, 1982
4.227 bln
+301.388 mln
7.68%
jan 1, 1983
3.512 bln
-715.55 mln
-16.93%
jan 1, 1984
3.889 bln
+377.203 mln
10.74%
jan 1, 1985
3.889 bln
+644.103K
0.02%
jan 1, 1986
4.573 bln
+683.35 mln
17.57%
jan 1, 1987
4.665 bln
+91.944 mln
2.01%
jan 1, 1988
5.735 bln
+1.07 bln
22.95%
jan 1, 1989
6.529 bln
+794.103 mln
13.85%
jan 1, 1990
7.033 bln
+503.531 mln
7.71%
jan 1, 1991
7.649 bln
+615.807 mln
8.76%
jan 1, 1992
8.24 bln
+591.793 mln
7.74%
jan 1, 1993
9.897 bln
+1.656 bln
20.1%
jan 1, 1994
9.411 bln
-485.377 mln
-4.9%
jan 1, 1995
9.698 bln
+286.288 mln
3.04%
jan 1, 1996
9.382 bln
-315.585 mln
-3.25%
jan 1, 1997
12.94 bln
+3.558 bln
37.92%
jan 1, 1998
10.468 bln
-2.472 bln
-19.1%
jan 1, 1999
10.917 bln
+448.919 mln
4.29%
jan 1, 2000
10.097 bln
-820.517 mln
-7.52%
jan 1, 2001
9.853 bln
-243.693 mln
-2.41%
jan 1, 2002
9.898 bln
+45.194 mln
0.46%
jan 1, 2003
10.383 bln
+485.07 mln
4.9%
jan 1, 2004
12.929 bln
+2.546 bln
24.52%
jan 1, 2005
16.917 bln
+3.988 bln
30.85%
jan 1, 2006
34.054 bln
+17.137 bln
101.3%
jan 1, 2007
40.538 bln
+6.484 bln
19.04%
jan 1, 2008
47.101 bln
+6.563 bln
16.19%
jan 1, 2009
54.941 bln
+7.841 bln
16.65%
jan 1, 2010
52.139 bln
-2.802 bln
-5.1%
jan 1, 2011
56.326 bln
+4.187 bln
8.03%
jan 1, 2012
60.468 bln
+4.142 bln
7.35%
jan 1, 2013
62.375 bln
+1.908 bln
3.15%
jan 1, 2014
58.353 bln
-4.022 bln
-6.45%
jan 1, 2015
57.939 bln
-414.005 mln
-0.71%
Ranking of countries by current statistics by years


Comments: