29
/
en
AIzaSyAYiBZKx7MnpbEhh9jyipgxe19OcubqV5w
April 1, 2024
151094
Honduras
HND
true
2
1
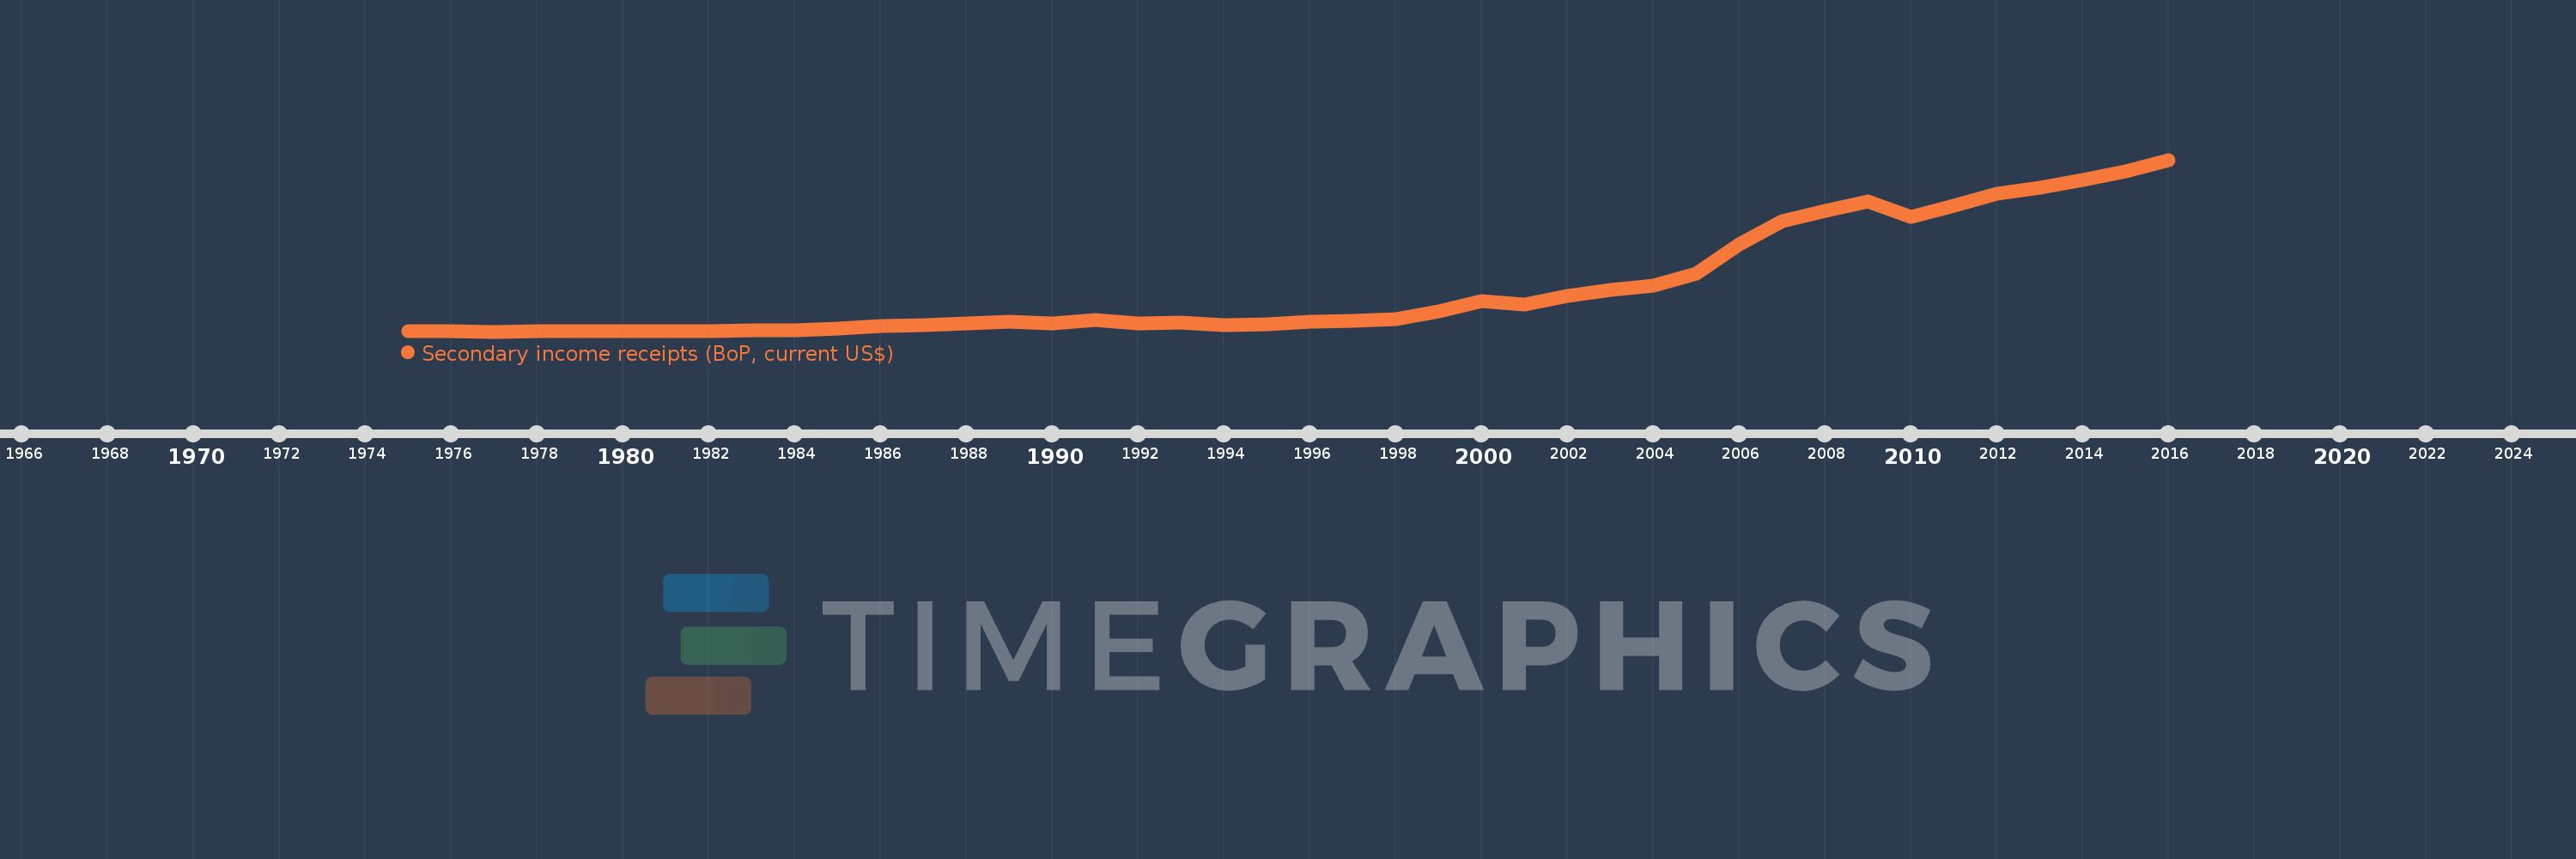
Secondary income receipts (BoP, current US$)
2016,2015,2014,2013,2012,2011,2010,2009,2008,2007,2006,2005,2004,2003,2002,2001,2000,1999,1998,1997,1996,1995,1994,1993,1992,1991,1990,1989,1988,1987,1986,1985,1984,1983,1982,1981,1980,1979,1978,1977,1976,1975
This statistics in other country:
AfghanistanAlbaniaAlgeriaAngolaAntigua and BarbudaArab WorldArgentinaArmeniaArubaAustraliaAustriaAzerbaijanBahamas, TheBahrainBangladeshBarbadosBelarusBelgiumBelizeBeninBermudaBhutanBoliviaBosnia and HerzegovinaBotswanaBrazilBrunei DarussalamBulgariaBurkina FasoBurundiCabo VerdeCambodiaCameroonCanadaCaribbean small statesCentral African RepublicCentral Europe and the BalticsChadChileChinaColombiaComorosCongo, Dem. Rep.Congo, Rep.Costa RicaCote d'IvoireCroatiaCuracaoCyprusCzech RepublicDenmarkDjiboutiDominicaDominican RepublicEarly-demographic dividendEast Asia & PacificEast Asia & Pacific (excluding high income)East Asia & Pacific (IDA & IBRD countries)EcuadorEgypt, Arab Rep.El SalvadorEquatorial GuineaEritreaEstoniaEthiopiaEuro areaEurope & Central AsiaEurope & Central Asia (excluding high income)Europe & Central Asia (IDA & IBRD countries)European UnionFaroe IslandsFijiFinlandFragile and conflict affected situationsFranceFrench PolynesiaGabonGambia, TheGeorgiaGermanyGhanaGreeceGrenadaGuatemalaGuineaGuinea-BissauGuyanaHaitiHeavily indebted poor countries (HIPC)High incomeHondurasHong Kong SAR, ChinaHungaryIBRD onlyIcelandIDA & IBRD totalIDA blendIDA onlyIDA totalIndiaIndonesiaIran, Islamic Rep.IraqIrelandIsraelItalyJamaicaJapanJordanKazakhstanKenyaKiribatiKorea, Rep.KosovoKuwaitKyrgyz RepublicLao PDRLate-demographic dividendLatin America & Caribbean Latin America & Caribbean (excluding high income)Latin America & the Caribbean (IDA & IBRD countries)LatviaLeast developed countries: UN classificationLebanonLesothoLiberiaLibyaLithuaniaLow & middle incomeLow incomeLower middle incomeLuxembourgMacao SAR, ChinaMacedonia, FYRMadagascarMalawiMalaysiaMaldivesMaliMaltaMarshall IslandsMauritaniaMauritiusMexicoMicronesia, Fed. Sts.Middle East & North AfricaMiddle East & North Africa (excluding high income)Middle East & North Africa (IDA & IBRD countries)Middle incomeMoldovaMongoliaMontenegroMoroccoMozambiqueMyanmarNamibiaNepalNetherlandsNew CaledoniaNew ZealandNicaraguaNigerNigeriaNorth AmericaNorwayOECD membersOmanOther small statesPacific island small statesPakistanPalauPanamaPapua New GuineaParaguayPeruPhilippinesPolandPortugalPost-demographic dividendPre-demographic dividendQatarRomaniaRussian FederationRwandaSamoaSao Tome and PrincipeSaudi ArabiaSenegalSerbiaSeychellesSierra LeoneSingaporeSint Maarten (Dutch part)Slovak RepublicSloveniaSmall statesSolomon IslandsSouth AfricaSouth AsiaSouth Asia (IDA & IBRD)South SudanSpainSri LankaSt. Kitts and NevisSt. LuciaSt. Vincent and the GrenadinesSub-Saharan Africa Sub-Saharan Africa (excluding high income)Sub-Saharan Africa (IDA & IBRD countries)SudanSurinameSwazilandSwedenSwitzerlandSyrian Arab RepublicTajikistanTanzaniaThailandTimor-LesteTogoTongaTrinidad and TobagoTunisiaTurkeyTuvaluUgandaUkraineUnited KingdomUnited StatesUpper middle incomeUruguayVanuatuVenezuela, RBVietnamWest Bank and GazaWorldYemen, Rep.ZambiaZimbabwe Timeline:
This timeline shows a graph from 1975 to 2016 of Honduras. No data until 1974. Number of actual observations by date: 42.
Source name:
World Development Indicators
Source organization:
International Monetary Fund, Balance of Payments Statistics Yearbook and data files.
Categories, topics:
Economy & Growth
Last updated:
apr 23, 2017
Indicators value changes by year
Minimum:
19.45 mln
jan 1, 1977
Maximum:
4.018 bln
jan 1, 2016
At the date of observation
Value
Absolute change
Change from previous value
jan 1, 1975
37.4 mln
+37.4 mln
0.0%
jan 1, 1976
23.2 mln
-14.2 mln
-37.97%
jan 1, 1977
19.45 mln
-3.75 mln
-16.16%
jan 1, 1978
20.6 mln
+1.15 mln
5.91%
jan 1, 1979
25.4 mln
+4.8 mln
23.3%
jan 1, 1980
35.45 mln
+10.05 mln
39.57%
jan 1, 1981
37.7 mln
+2.25 mln
6.35%
jan 1, 1982
38.05 mln
+350.0K
0.93%
jan 1, 1983
40.0 mln
+1.95 mln
5.12%
jan 1, 1984
55.6 mln
+15.6 mln
39.0%
jan 1, 1985
91.5 mln
+35.9 mln
64.57%
jan 1, 1986
157.5 mln
+66.0 mln
72.13%
jan 1, 1987
170.85 mln
+13.35 mln
8.48%
jan 1, 1988
205.45 mln
+34.6 mln
20.25%
jan 1, 1989
248.6 mln
+43.15 mln
21.0%
jan 1, 1990
204.6 mln
-44.0 mln
-17.7%
jan 1, 1991
291.2 mln
+86.6 mln
42.33%
jan 1, 1992
207.3 mln
-83.9 mln
-28.81%
jan 1, 1993
226.3 mln
+19.0 mln
9.17%
jan 1, 1994
165.5 mln
-60.8 mln
-26.87%
jan 1, 1995
190.2 mln
+24.7 mln
14.92%
jan 1, 1996
243.7 mln
+53.5 mln
28.13%
jan 1, 1997
271.7 mln
+28.0 mln
11.49%
jan 1, 1998
306.8 mln
+35.1 mln
12.92%
jan 1, 1999
488.8 mln
+182.0 mln
59.32%
jan 1, 2000
738.3 mln
+249.5 mln
51.04%
jan 1, 2001
654.198 mln
-84.102 mln
-11.39%
jan 1, 2002
840.442 mln
+186.243 mln
28.47%
jan 1, 2003
983.399 mln
+142.957 mln
17.01%
jan 1, 2004
1.092 bln
+108.492 mln
11.03%
jan 1, 2005
1.374 bln
+282.06 mln
25.83%
jan 1, 2006
2.042 bln
+668.497 mln
48.66%
jan 1, 2007
2.589 bln
+546.24 mln
26.74%
jan 1, 2008
2.825 bln
+236.562 mln
9.14%
jan 1, 2009
3.044 bln
+219.181 mln
7.76%
jan 1, 2010
2.697 bln
-347.465 mln
-11.41%
jan 1, 2011
2.949 bln
+252.372 mln
9.36%
jan 1, 2012
3.22 bln
+271.146 mln
9.19%
jan 1, 2013
3.369 bln
+148.533 mln
4.61%
jan 1, 2014
3.541 bln
+171.902 mln
5.1%
jan 1, 2015
3.752 bln
+210.631 mln
5.95%
jan 1, 2016
4.018 bln
+266.868 mln
7.11%
Ranking of countries by current statistics by years


Comments: