29
/
en
AIzaSyAYiBZKx7MnpbEhh9jyipgxe19OcubqV5w
April 1, 2024
226389
Portugal
PRT
true
2
1
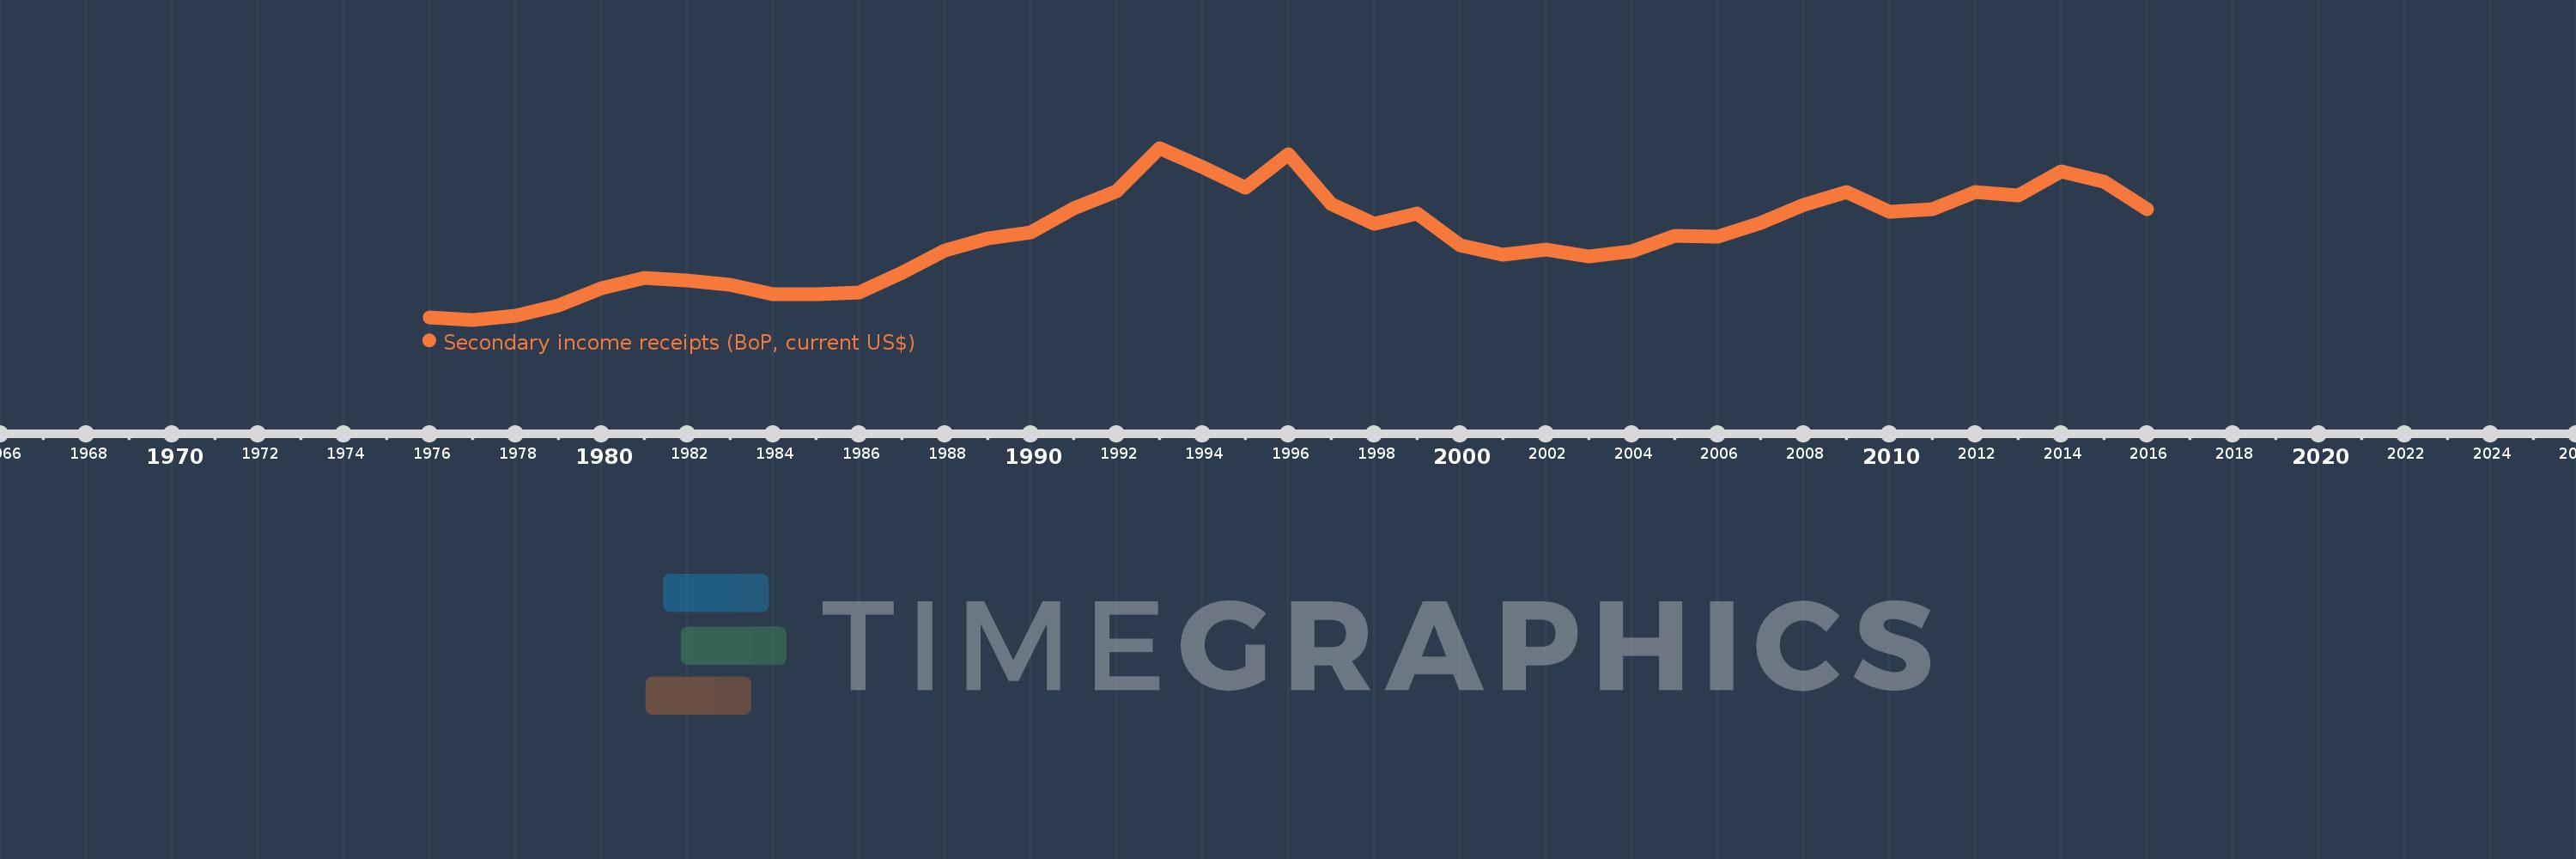
Secondary income receipts (BoP, current US$)
2016,2015,2014,2013,2012,2011,2010,2009,2008,2007,2006,2005,2004,2003,2002,2001,2000,1999,1998,1997,1996,1995,1994,1993,1992,1991,1990,1989,1988,1987,1986,1985,1984,1983,1982,1981,1980,1979,1978,1977,1976
This statistics in other country:
AfghanistanAlbaniaAlgeriaAngolaAntigua and BarbudaArab WorldArgentinaArmeniaArubaAustraliaAustriaAzerbaijanBahamas, TheBahrainBangladeshBarbadosBelarusBelgiumBelizeBeninBermudaBhutanBoliviaBosnia and HerzegovinaBotswanaBrazilBrunei DarussalamBulgariaBurkina FasoBurundiCabo VerdeCambodiaCameroonCanadaCaribbean small statesCentral African RepublicCentral Europe and the BalticsChadChileChinaColombiaComorosCongo, Dem. Rep.Congo, Rep.Costa RicaCote d'IvoireCroatiaCuracaoCyprusCzech RepublicDenmarkDjiboutiDominicaDominican RepublicEarly-demographic dividendEast Asia & PacificEast Asia & Pacific (excluding high income)East Asia & Pacific (IDA & IBRD countries)EcuadorEgypt, Arab Rep.El SalvadorEquatorial GuineaEritreaEstoniaEthiopiaEuro areaEurope & Central AsiaEurope & Central Asia (excluding high income)Europe & Central Asia (IDA & IBRD countries)European UnionFaroe IslandsFijiFinlandFragile and conflict affected situationsFranceFrench PolynesiaGabonGambia, TheGeorgiaGermanyGhanaGreeceGrenadaGuatemalaGuineaGuinea-BissauGuyanaHaitiHeavily indebted poor countries (HIPC)High incomeHondurasHong Kong SAR, ChinaHungaryIBRD onlyIcelandIDA & IBRD totalIDA blendIDA onlyIDA totalIndiaIndonesiaIran, Islamic Rep.IraqIrelandIsraelItalyJamaicaJapanJordanKazakhstanKenyaKiribatiKorea, Rep.KosovoKuwaitKyrgyz RepublicLao PDRLate-demographic dividendLatin America & Caribbean Latin America & Caribbean (excluding high income)Latin America & the Caribbean (IDA & IBRD countries)LatviaLeast developed countries: UN classificationLebanonLesothoLiberiaLibyaLithuaniaLow & middle incomeLow incomeLower middle incomeLuxembourgMacao SAR, ChinaMacedonia, FYRMadagascarMalawiMalaysiaMaldivesMaliMaltaMarshall IslandsMauritaniaMauritiusMexicoMicronesia, Fed. Sts.Middle East & North AfricaMiddle East & North Africa (excluding high income)Middle East & North Africa (IDA & IBRD countries)Middle incomeMoldovaMongoliaMontenegroMoroccoMozambiqueMyanmarNamibiaNepalNetherlandsNew CaledoniaNew ZealandNicaraguaNigerNigeriaNorth AmericaNorwayOECD membersOmanOther small statesPacific island small statesPakistanPalauPanamaPapua New GuineaParaguayPeruPhilippinesPolandPortugalPost-demographic dividendPre-demographic dividendQatarRomaniaRussian FederationRwandaSamoaSao Tome and PrincipeSaudi ArabiaSenegalSerbiaSeychellesSierra LeoneSingaporeSint Maarten (Dutch part)Slovak RepublicSloveniaSmall statesSolomon IslandsSouth AfricaSouth AsiaSouth Asia (IDA & IBRD)South SudanSpainSri LankaSt. Kitts and NevisSt. LuciaSt. Vincent and the GrenadinesSub-Saharan Africa Sub-Saharan Africa (excluding high income)Sub-Saharan Africa (IDA & IBRD countries)SudanSurinameSwazilandSwedenSwitzerlandSyrian Arab RepublicTajikistanTanzaniaThailandTimor-LesteTogoTongaTrinidad and TobagoTunisiaTurkeyTuvaluUgandaUkraineUnited KingdomUnited StatesUpper middle incomeUruguayVanuatuVenezuela, RBVietnamWest Bank and GazaWorldYemen, Rep.ZambiaZimbabwe Timeline:
This timeline shows a graph from 1976 to 2016 of Portugal. No data until 1975. Number of actual observations by date: 41.
Source name:
World Development Indicators
Source organization:
International Monetary Fund, Balance of Payments Statistics Yearbook and data files.
Categories, topics:
Economy & Growth
Last updated:
apr 23, 2017
Indicators value changes by year
Minimum:
1.007 bln
jan 1, 1977
Maximum:
9.344 bln
jan 1, 1993
At the date of observation
Value
Absolute change
Change from previous value
jan 1, 1976
1.103 bln
+1.103 bln
0.0%
jan 1, 1977
1.007 bln
-96.315 mln
-8.73%
jan 1, 1978
1.222 bln
+215.918 mln
21.45%
jan 1, 1979
1.718 bln
+495.544 mln
40.54%
jan 1, 1980
2.536 bln
+818.026 mln
47.61%
jan 1, 1981
3.047 bln
+511.183 mln
20.16%
jan 1, 1982
2.918 bln
-128.788 mln
-4.23%
jan 1, 1983
2.718 bln
-200.072 mln
-6.86%
jan 1, 1984
2.245 bln
-473.488 mln
-17.42%
jan 1, 1985
2.257 bln
+11.902 mln
0.53%
jan 1, 1986
2.329 bln
+71.811 mln
3.18%
jan 1, 1987
3.306 bln
+977.01 mln
41.96%
jan 1, 1988
4.365 bln
+1.06 bln
32.06%
jan 1, 1989
4.946 bln
+580.688 mln
13.3%
jan 1, 1990
5.227 bln
+281.318 mln
5.69%
jan 1, 1991
6.433 bln
+1.206 bln
23.07%
jan 1, 1992
7.237 bln
+804.18 mln
12.5%
jan 1, 1993
9.344 bln
+2.106 bln
29.1%
jan 1, 1994
8.395 bln
-948.721 mln
-10.15%
jan 1, 1995
7.41 bln
-985.063 mln
-11.73%
jan 1, 1996
9.046 bln
+1.636 bln
22.08%
jan 1, 1997
6.627 bln
-2.419 bln
-26.74%
jan 1, 1998
5.671 bln
-956.127 mln
-14.43%
jan 1, 1999
6.17 bln
+498.844 mln
8.8%
jan 1, 2000
4.62 bln
-1.55 bln
-25.13%
jan 1, 2001
4.156 bln
-463.586 mln
-10.04%
jan 1, 2002
4.425 bln
+268.526 mln
6.46%
jan 1, 2003
4.061 bln
-363.536 mln
-8.22%
jan 1, 2004
4.311 bln
+250.463 mln
6.17%
jan 1, 2005
5.097 bln
+785.108 mln
18.21%
jan 1, 2006
5.026 bln
-70.97 mln
-1.39%
jan 1, 2007
5.715 bln
+688.938 mln
13.71%
jan 1, 2008
6.575 bln
+860.338 mln
15.06%
jan 1, 2009
7.205 bln
+629.842 mln
9.58%
jan 1, 2010
6.227 bln
-977.764 mln
-13.57%
jan 1, 2011
6.366 bln
+138.934 mln
2.23%
jan 1, 2012
7.192 bln
+825.764 mln
12.97%
jan 1, 2013
7.04 bln
-152.023 mln
-2.11%
jan 1, 2014
8.22 bln
+1.18 bln
16.77%
jan 1, 2015
7.705 bln
-515.352 mln
-6.27%
jan 1, 2016
6.366 bln
-1.338 bln
-17.37%
Ranking of countries by current statistics by years


Comments: