29
/
en
AIzaSyAYiBZKx7MnpbEhh9jyipgxe19OcubqV5w
April 1, 2024
52240
North America
NAC
false
2
1
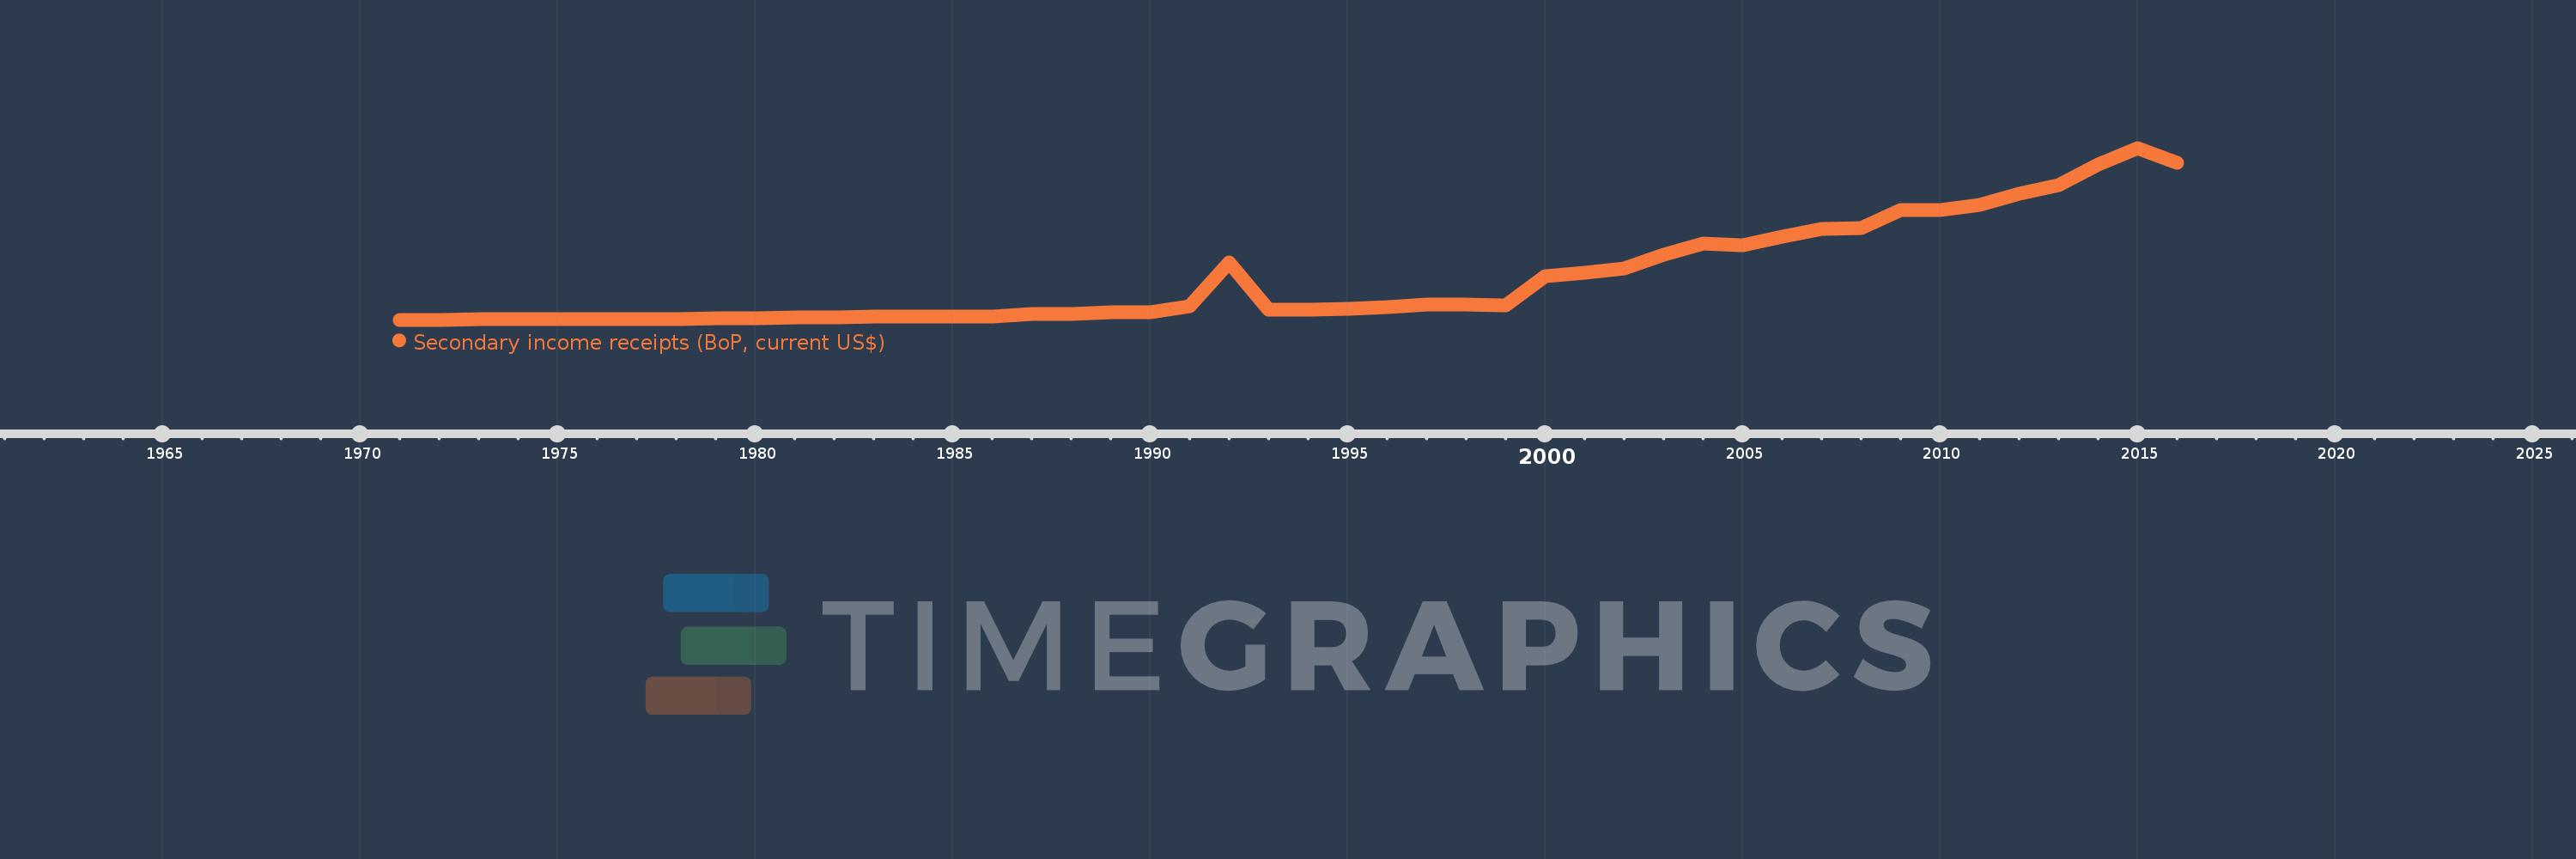
Secondary income receipts (BoP, current US$)
2016,2015,2014,2013,2012,2011,2010,2009,2008,2007,2006,2005,2004,2003,2002,2001,2000,1999,1998,1997,1996,1995,1994,1993,1992,1991,1990,1989,1988,1987,1986,1985,1984,1983,1982,1981,1980,1979,1978,1977,1976,1975,1974,1973,1972,1971
This statistics in other country:
AfghanistanAlbaniaAlgeriaAngolaAntigua and BarbudaArab WorldArgentinaArmeniaArubaAustraliaAustriaAzerbaijanBahamas, TheBahrainBangladeshBarbadosBelarusBelgiumBelizeBeninBermudaBhutanBoliviaBosnia and HerzegovinaBotswanaBrazilBrunei DarussalamBulgariaBurkina FasoBurundiCabo VerdeCambodiaCameroonCanadaCaribbean small statesCentral African RepublicCentral Europe and the BalticsChadChileChinaColombiaComorosCongo, Dem. Rep.Congo, Rep.Costa RicaCote d'IvoireCroatiaCuracaoCyprusCzech RepublicDenmarkDjiboutiDominicaDominican RepublicEarly-demographic dividendEast Asia & PacificEast Asia & Pacific (excluding high income)East Asia & Pacific (IDA & IBRD countries)EcuadorEgypt, Arab Rep.El SalvadorEquatorial GuineaEritreaEstoniaEthiopiaEuro areaEurope & Central AsiaEurope & Central Asia (excluding high income)Europe & Central Asia (IDA & IBRD countries)European UnionFaroe IslandsFijiFinlandFragile and conflict affected situationsFranceFrench PolynesiaGabonGambia, TheGeorgiaGermanyGhanaGreeceGrenadaGuatemalaGuineaGuinea-BissauGuyanaHaitiHeavily indebted poor countries (HIPC)High incomeHondurasHong Kong SAR, ChinaHungaryIBRD onlyIcelandIDA & IBRD totalIDA blendIDA onlyIDA totalIndiaIndonesiaIran, Islamic Rep.IraqIrelandIsraelItalyJamaicaJapanJordanKazakhstanKenyaKiribatiKorea, Rep.KosovoKuwaitKyrgyz RepublicLao PDRLate-demographic dividendLatin America & Caribbean Latin America & Caribbean (excluding high income)Latin America & the Caribbean (IDA & IBRD countries)LatviaLeast developed countries: UN classificationLebanonLesothoLiberiaLibyaLithuaniaLow & middle incomeLow incomeLower middle incomeLuxembourgMacao SAR, ChinaMacedonia, FYRMadagascarMalawiMalaysiaMaldivesMaliMaltaMarshall IslandsMauritaniaMauritiusMexicoMicronesia, Fed. Sts.Middle East & North AfricaMiddle East & North Africa (excluding high income)Middle East & North Africa (IDA & IBRD countries)Middle incomeMoldovaMongoliaMontenegroMoroccoMozambiqueMyanmarNamibiaNepalNetherlandsNew CaledoniaNew ZealandNicaraguaNigerNigeriaNorth AmericaNorwayOECD membersOmanOther small statesPacific island small statesPakistanPalauPanamaPapua New GuineaParaguayPeruPhilippinesPolandPortugalPost-demographic dividendPre-demographic dividendQatarRomaniaRussian FederationRwandaSamoaSao Tome and PrincipeSaudi ArabiaSenegalSerbiaSeychellesSierra LeoneSingaporeSint Maarten (Dutch part)Slovak RepublicSloveniaSmall statesSolomon IslandsSouth AfricaSouth AsiaSouth Asia (IDA & IBRD)South SudanSpainSri LankaSt. Kitts and NevisSt. LuciaSt. Vincent and the GrenadinesSub-Saharan Africa Sub-Saharan Africa (excluding high income)Sub-Saharan Africa (IDA & IBRD countries)SudanSurinameSwazilandSwedenSwitzerlandSyrian Arab RepublicTajikistanTanzaniaThailandTimor-LesteTogoTongaTrinidad and TobagoTunisiaTurkeyTuvaluUgandaUkraineUnited KingdomUnited StatesUpper middle incomeUruguayVanuatuVenezuela, RBVietnamWest Bank and GazaWorldYemen, Rep.ZambiaZimbabwe Timeline:
This timeline shows a graph from 1971 to 2016 of North America. No data until 1970. Number of actual observations by date: 46.
Source name:
World Development Indicators
Source organization:
International Monetary Fund, Balance of Payments Statistics Yearbook and data files.
Categories, topics:
Economy & Growth
Last updated:
apr 23, 2017
Indicators value changes by year
Minimum:
746.253 mln
jan 1, 1971
Maximum:
150.484 bln
jan 1, 2015
At the date of observation
Value
Absolute change
Change from previous value
jan 1, 1971
746.253 mln
+746.253 mln
0.0%
jan 1, 1972
836.469 mln
+90.216 mln
12.09%
jan 1, 1973
1.075 bln
+238.783 mln
28.55%
jan 1, 1974
1.239 bln
+163.767 mln
15.23%
jan 1, 1975
1.401 bln
+161.82 mln
13.06%
jan 1, 1976
1.429 bln
+28.392 mln
2.03%
jan 1, 1977
1.547 bln
+117.967 mln
8.25%
jan 1, 1978
1.513 bln
-34.599 mln
-2.24%
jan 1, 1979
1.654 bln
+141.811 mln
9.38%
jan 1, 1980
2.177 bln
+522.412 mln
31.58%
jan 1, 1981
2.63 bln
+452.848 mln
20.8%
jan 1, 1982
2.712 bln
+82.442 mln
3.14%
jan 1, 1983
3.59 bln
+878.113 mln
32.38%
jan 1, 1984
3.449 bln
-141.458 mln
-3.94%
jan 1, 1985
3.53 bln
+81.32 mln
2.36%
jan 1, 1986
3.82 bln
+289.467 mln
8.2%
jan 1, 1987
5.447 bln
+1.628 bln
42.62%
jan 1, 1988
5.636 bln
+188.406 mln
3.46%
jan 1, 1989
6.958 bln
+1.322 bln
23.45%
jan 1, 1990
7.538 bln
+580.387 mln
8.34%
jan 1, 1991
12.744 bln
+5.206 bln
69.07%
jan 1, 1992
50.487 bln
+37.742 bln
296.16%
jan 1, 1993
9.192 bln
-41.295 bln
-81.79%
jan 1, 1994
9.303 bln
+111.356 mln
1.21%
jan 1, 1995
10.486 bln
+1.183 bln
12.71%
jan 1, 1996
11.461 bln
+974.927 mln
9.3%
jan 1, 1997
13.985 bln
+2.524 bln
22.03%
jan 1, 1998
13.796 bln
-189.571 mln
-1.36%
jan 1, 1999
13.577 bln
-218.497 mln
-1.58%
jan 1, 2000
38.55 bln
+24.973 bln
183.93%
jan 1, 2001
41.461 bln
+2.911 bln
7.55%
jan 1, 2002
45.795 bln
+4.334 bln
10.45%
jan 1, 2003
57.259 bln
+11.464 bln
25.03%
jan 1, 2004
66.861 bln
+9.601 bln
16.77%
jan 1, 2005
65.928 bln
-933.028 mln
-1.4%
jan 1, 2006
73.103 bln
+7.176 bln
10.88%
jan 1, 2007
79.957 bln
+6.854 bln
9.38%
jan 1, 2008
80.928 bln
+970.825 mln
1.21%
jan 1, 2009
96.325 bln
+15.397 bln
19.03%
jan 1, 2010
96.482 bln
+157.172 mln
0.16%
jan 1, 2011
101.108 bln
+4.626 bln
4.79%
jan 1, 2012
110.415 bln
+9.307 bln
9.2%
jan 1, 2013
118.151 bln
+7.736 bln
7.01%
jan 1, 2014
136.309 bln
+18.158 bln
15.37%
jan 1, 2015
150.484 bln
+14.174 bln
10.4%
jan 1, 2016
137.355 bln
-13.129 bln
-8.72%
Ranking of countries by current statistics by years


Comments: