29
/
en
AIzaSyAYiBZKx7MnpbEhh9jyipgxe19OcubqV5w
April 1, 2024
255810
Swaziland
SWZ
true
2
1
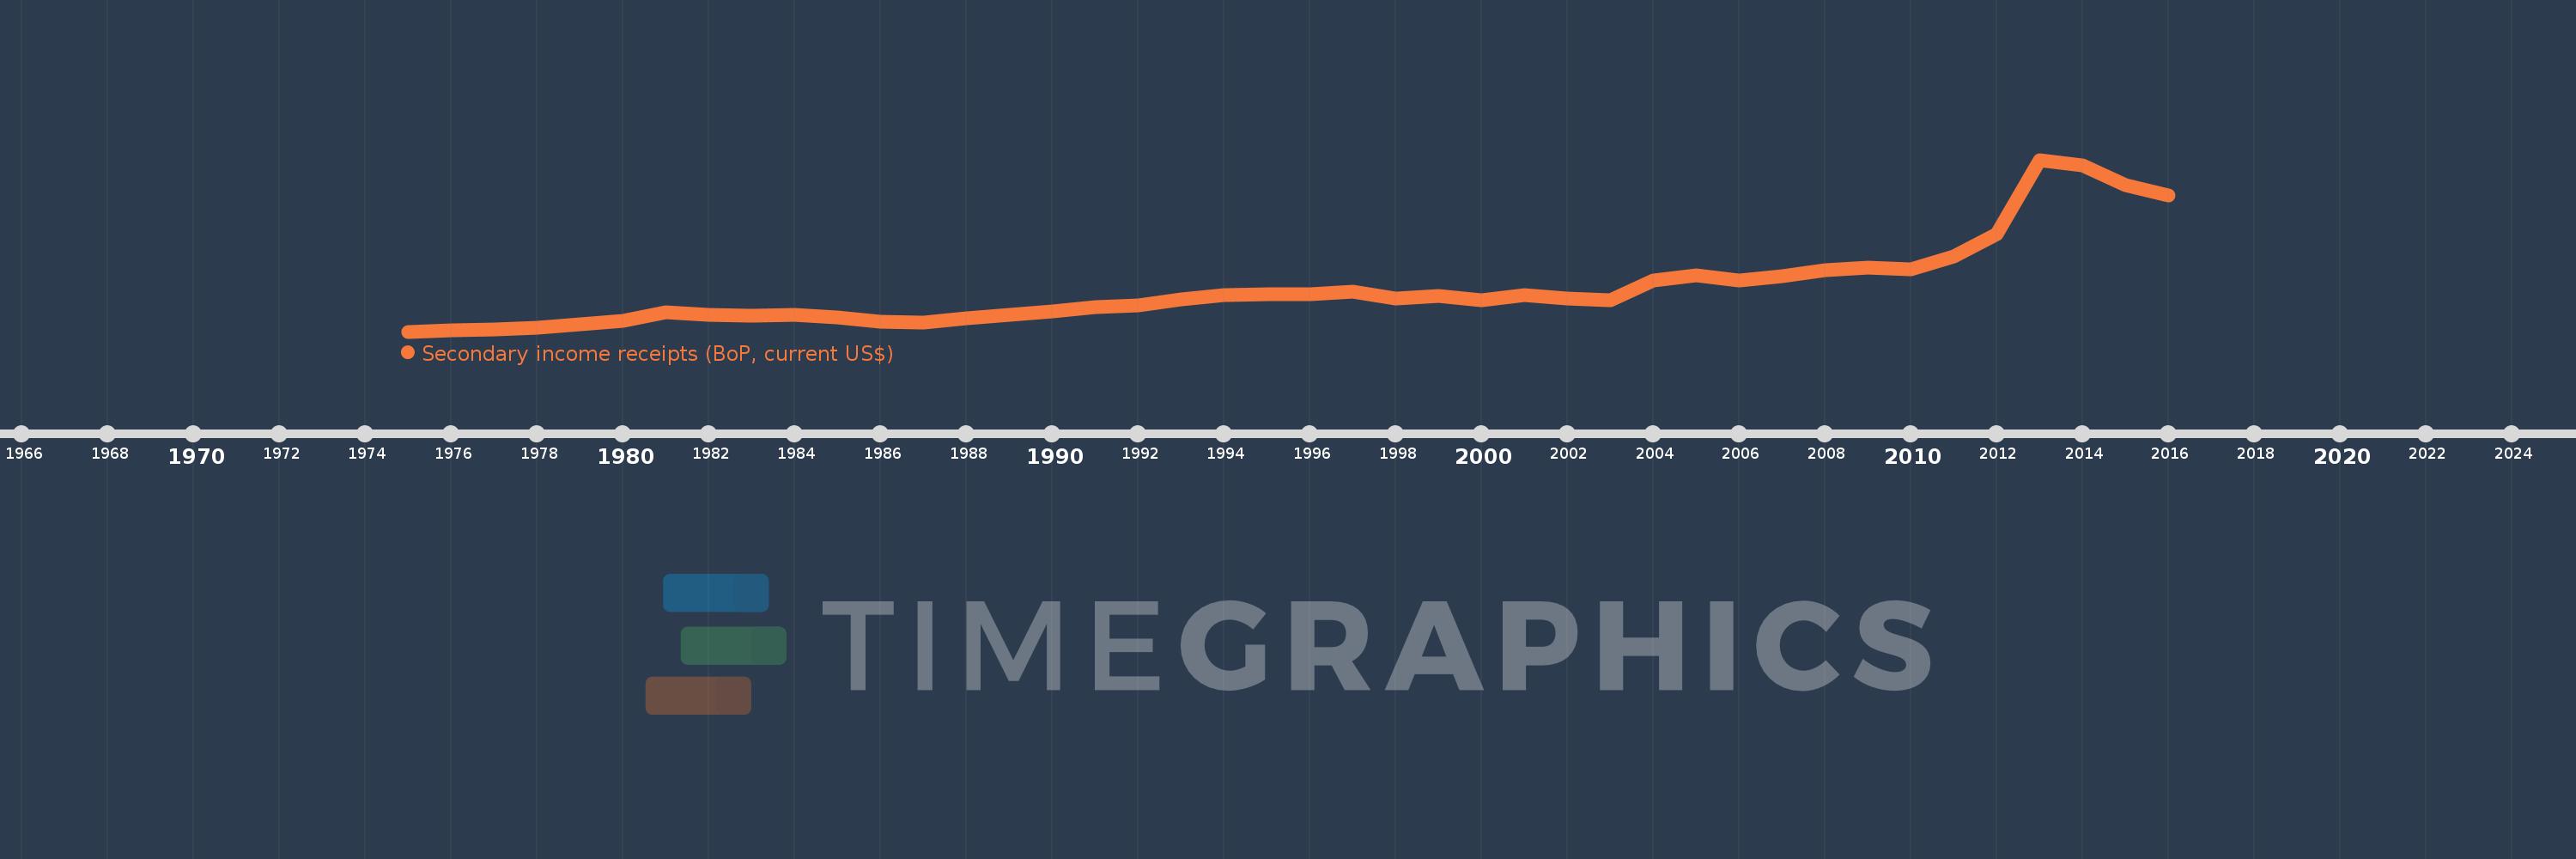
Secondary income receipts (BoP, current US$)
2016,2015,2014,2013,2012,2011,2010,2009,2008,2007,2006,2005,2004,2003,2002,2001,2000,1999,1998,1997,1996,1995,1994,1993,1992,1991,1990,1989,1988,1987,1986,1985,1984,1983,1982,1981,1980,1979,1978,1977,1976,1975
This statistics in other country:
AfghanistanAlbaniaAlgeriaAngolaAntigua and BarbudaArab WorldArgentinaArmeniaArubaAustraliaAustriaAzerbaijanBahamas, TheBahrainBangladeshBarbadosBelarusBelgiumBelizeBeninBermudaBhutanBoliviaBosnia and HerzegovinaBotswanaBrazilBrunei DarussalamBulgariaBurkina FasoBurundiCabo VerdeCambodiaCameroonCanadaCaribbean small statesCentral African RepublicCentral Europe and the BalticsChadChileChinaColombiaComorosCongo, Dem. Rep.Congo, Rep.Costa RicaCote d'IvoireCroatiaCuracaoCyprusCzech RepublicDenmarkDjiboutiDominicaDominican RepublicEarly-demographic dividendEast Asia & PacificEast Asia & Pacific (excluding high income)East Asia & Pacific (IDA & IBRD countries)EcuadorEgypt, Arab Rep.El SalvadorEquatorial GuineaEritreaEstoniaEthiopiaEuro areaEurope & Central AsiaEurope & Central Asia (excluding high income)Europe & Central Asia (IDA & IBRD countries)European UnionFaroe IslandsFijiFinlandFragile and conflict affected situationsFranceFrench PolynesiaGabonGambia, TheGeorgiaGermanyGhanaGreeceGrenadaGuatemalaGuineaGuinea-BissauGuyanaHaitiHeavily indebted poor countries (HIPC)High incomeHondurasHong Kong SAR, ChinaHungaryIBRD onlyIcelandIDA & IBRD totalIDA blendIDA onlyIDA totalIndiaIndonesiaIran, Islamic Rep.IraqIrelandIsraelItalyJamaicaJapanJordanKazakhstanKenyaKiribatiKorea, Rep.KosovoKuwaitKyrgyz RepublicLao PDRLate-demographic dividendLatin America & Caribbean Latin America & Caribbean (excluding high income)Latin America & the Caribbean (IDA & IBRD countries)LatviaLeast developed countries: UN classificationLebanonLesothoLiberiaLibyaLithuaniaLow & middle incomeLow incomeLower middle incomeLuxembourgMacao SAR, ChinaMacedonia, FYRMadagascarMalawiMalaysiaMaldivesMaliMaltaMarshall IslandsMauritaniaMauritiusMexicoMicronesia, Fed. Sts.Middle East & North AfricaMiddle East & North Africa (excluding high income)Middle East & North Africa (IDA & IBRD countries)Middle incomeMoldovaMongoliaMontenegroMoroccoMozambiqueMyanmarNamibiaNepalNetherlandsNew CaledoniaNew ZealandNicaraguaNigerNigeriaNorth AmericaNorwayOECD membersOmanOther small statesPacific island small statesPakistanPalauPanamaPapua New GuineaParaguayPeruPhilippinesPolandPortugalPost-demographic dividendPre-demographic dividendQatarRomaniaRussian FederationRwandaSamoaSao Tome and PrincipeSaudi ArabiaSenegalSerbiaSeychellesSierra LeoneSingaporeSint Maarten (Dutch part)Slovak RepublicSloveniaSmall statesSolomon IslandsSouth AfricaSouth AsiaSouth Asia (IDA & IBRD)South SudanSpainSri LankaSt. Kitts and NevisSt. LuciaSt. Vincent and the GrenadinesSub-Saharan Africa Sub-Saharan Africa (excluding high income)Sub-Saharan Africa (IDA & IBRD countries)SudanSurinameSwazilandSwedenSwitzerlandSyrian Arab RepublicTajikistanTanzaniaThailandTimor-LesteTogoTongaTrinidad and TobagoTunisiaTurkeyTuvaluUgandaUkraineUnited KingdomUnited StatesUpper middle incomeUruguayVanuatuVenezuela, RBVietnamWest Bank and GazaWorldYemen, Rep.ZambiaZimbabwe Timeline:
This timeline shows a graph from 1975 to 2016 of Swaziland. No data until 1974. Number of actual observations by date: 42.
Source name:
World Development Indicators
Source organization:
International Monetary Fund, Balance of Payments Statistics Yearbook and data files.
Categories, topics:
Economy & Growth
Last updated:
apr 23, 2017
Indicators value changes by year
Minimum:
28.551 mln
jan 1, 1975
Maximum:
1.07 bln
jan 1, 2013
At the date of observation
Value
Absolute change
Change from previous value
jan 1, 1975
28.551 mln
+28.551 mln
0.0%
jan 1, 1976
37.187 mln
+8.636 mln
30.25%
jan 1, 1977
44.045 mln
+6.858 mln
18.44%
jan 1, 1978
50.37 mln
+6.325 mln
14.36%
jan 1, 1979
70.495 mln
+20.125 mln
39.95%
jan 1, 1980
95.035 mln
+24.54 mln
34.81%
jan 1, 1981
143.684 mln
+48.65 mln
51.19%
jan 1, 1982
131.669 mln
-12.016 mln
-8.36%
jan 1, 1983
123.594 mln
-8.075 mln
-6.13%
jan 1, 1984
128.085 mln
+4.492 mln
3.63%
jan 1, 1985
112.996 mln
-15.09 mln
-11.78%
jan 1, 1986
88.442 mln
-24.553 mln
-21.73%
jan 1, 1987
85.382 mln
-3.061 mln
-3.46%
jan 1, 1988
108.839 mln
+23.457 mln
27.47%
jan 1, 1989
127.822 mln
+18.983 mln
17.44%
jan 1, 1990
151.334 mln
+23.512 mln
18.39%
jan 1, 1991
175.355 mln
+24.021 mln
15.87%
jan 1, 1992
188.968 mln
+13.613 mln
7.76%
jan 1, 1993
222.404 mln
+33.436 mln
17.69%
jan 1, 1994
248.131 mln
+25.727 mln
11.57%
jan 1, 1995
252.626 mln
+4.495 mln
1.81%
jan 1, 1996
257.219 mln
+4.593 mln
1.82%
jan 1, 1997
268.723 mln
+11.505 mln
4.47%
jan 1, 1998
226.83 mln
-41.893 mln
-15.59%
jan 1, 1999
242.732 mln
+15.902 mln
7.01%
jan 1, 2000
220.296 mln
-22.435 mln
-9.24%
jan 1, 2001
247.509 mln
+27.212 mln
12.35%
jan 1, 2002
229.73 mln
-17.779 mln
-7.18%
jan 1, 2003
216.219 mln
-13.511 mln
-5.88%
jan 1, 2004
336.641 mln
+120.422 mln
55.69%
jan 1, 2005
370.85 mln
+34.209 mln
10.16%
jan 1, 2006
339.612 mln
-31.238 mln
-8.42%
jan 1, 2007
366.264 mln
+26.651 mln
7.85%
jan 1, 2008
403.473 mln
+37.209 mln
10.16%
jan 1, 2009
417.891 mln
+14.418 mln
3.57%
jan 1, 2010
405.653 mln
-12.238 mln
-2.93%
jan 1, 2011
482.843 mln
+77.19 mln
19.03%
jan 1, 2012
617.187 mln
+134.344 mln
27.82%
jan 1, 2013
1.07 bln
+453.188 mln
73.43%
jan 1, 2014
1.038 bln
-32.536 mln
-3.04%
jan 1, 2015
916.875 mln
-120.963 mln
-11.66%
jan 1, 2016
854.841 mln
-62.035 mln
-6.77%
Ranking of countries by current statistics by years


Comments: