29
/
en
AIzaSyAYiBZKx7MnpbEhh9jyipgxe19OcubqV5w
April 1, 2024
131161
Ethiopia
ETH
true
2
1
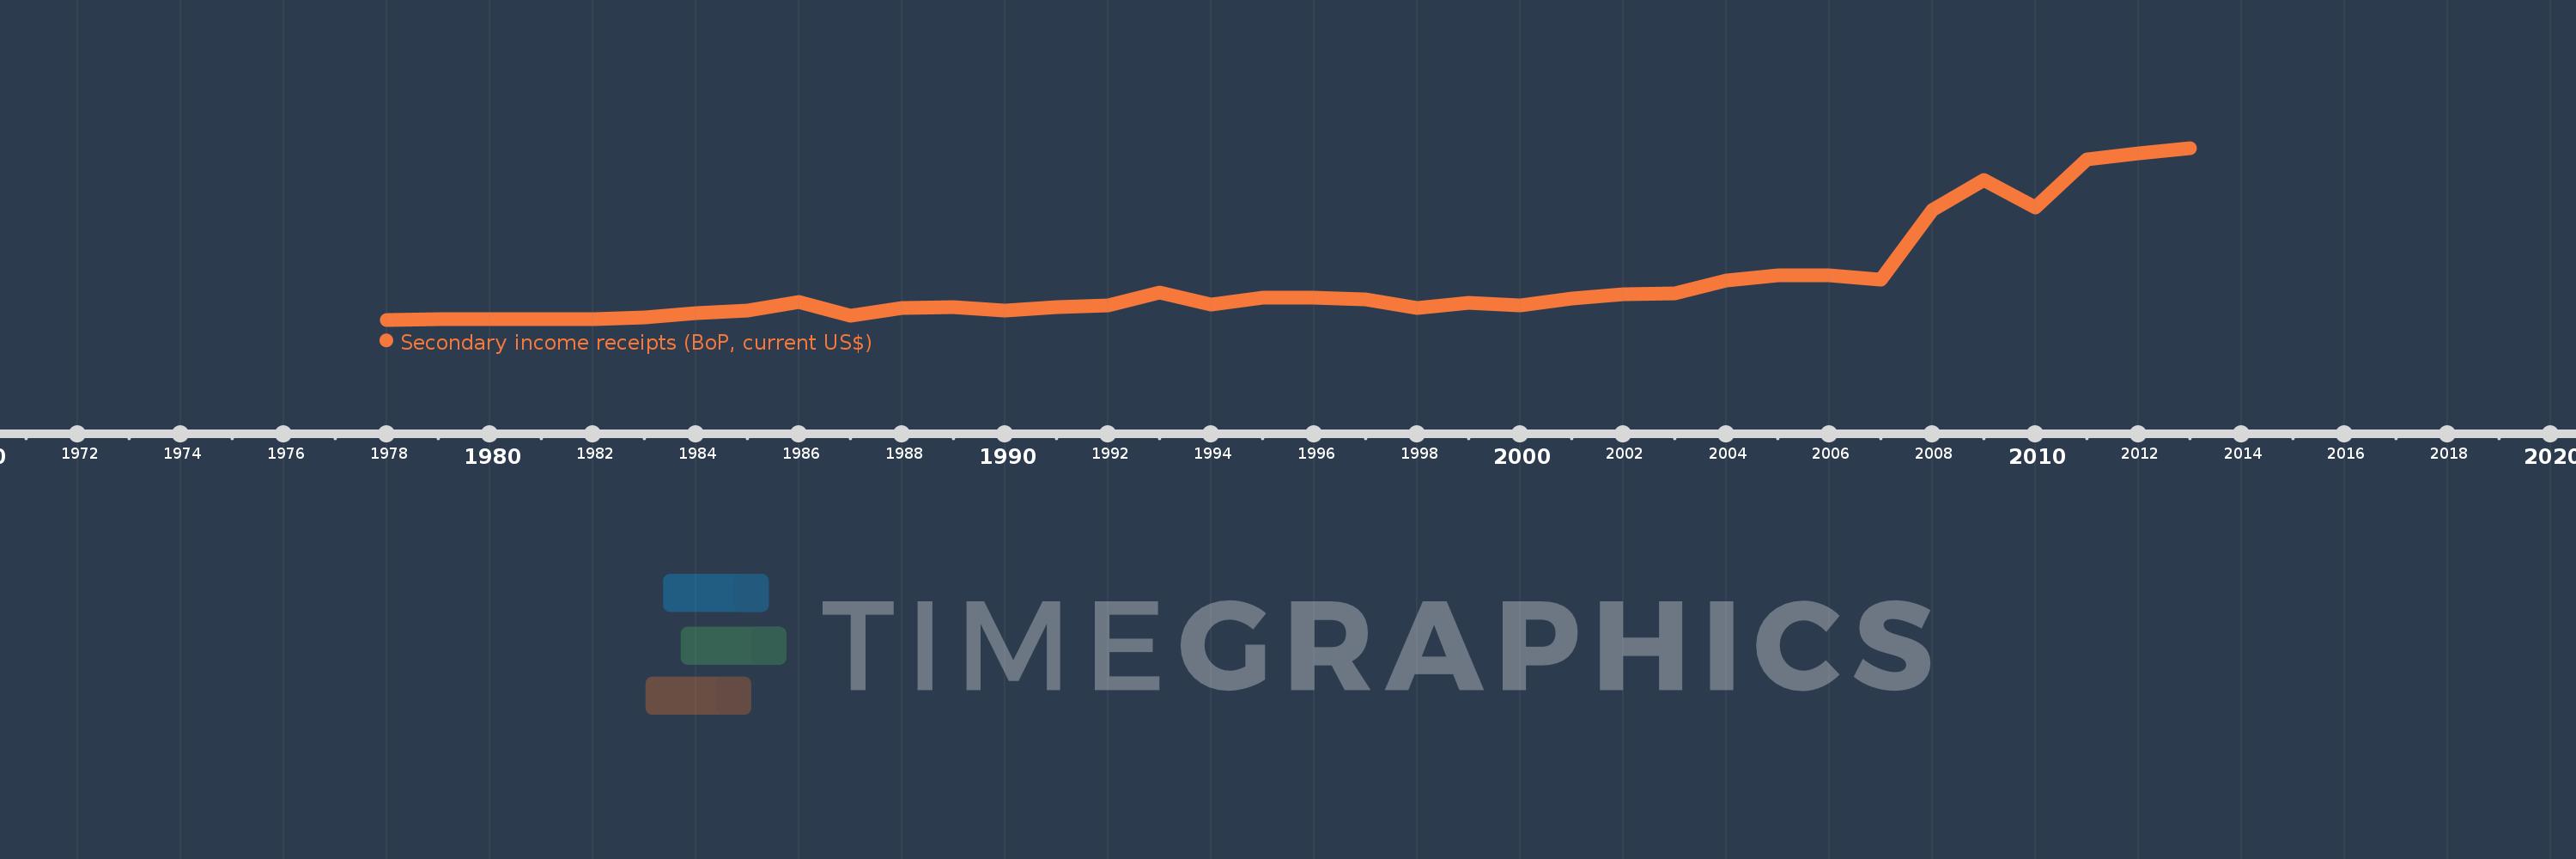
Secondary income receipts (BoP, current US$)
2013,2012,2011,2010,2009,2008,2007,2006,2005,2004,2003,2002,2001,2000,1999,1998,1997,1996,1995,1994,1993,1992,1991,1990,1989,1988,1987,1986,1985,1984,1983,1982,1981,1980,1979,1978
This statistics in other country:
AfghanistanAlbaniaAlgeriaAngolaAntigua and BarbudaArab WorldArgentinaArmeniaArubaAustraliaAustriaAzerbaijanBahamas, TheBahrainBangladeshBarbadosBelarusBelgiumBelizeBeninBermudaBhutanBoliviaBosnia and HerzegovinaBotswanaBrazilBrunei DarussalamBulgariaBurkina FasoBurundiCabo VerdeCambodiaCameroonCanadaCaribbean small statesCentral African RepublicCentral Europe and the BalticsChadChileChinaColombiaComorosCongo, Dem. Rep.Congo, Rep.Costa RicaCote d'IvoireCroatiaCuracaoCyprusCzech RepublicDenmarkDjiboutiDominicaDominican RepublicEarly-demographic dividendEast Asia & PacificEast Asia & Pacific (excluding high income)East Asia & Pacific (IDA & IBRD countries)EcuadorEgypt, Arab Rep.El SalvadorEquatorial GuineaEritreaEstoniaEthiopiaEuro areaEurope & Central AsiaEurope & Central Asia (excluding high income)Europe & Central Asia (IDA & IBRD countries)European UnionFaroe IslandsFijiFinlandFragile and conflict affected situationsFranceFrench PolynesiaGabonGambia, TheGeorgiaGermanyGhanaGreeceGrenadaGuatemalaGuineaGuinea-BissauGuyanaHaitiHeavily indebted poor countries (HIPC)High incomeHondurasHong Kong SAR, ChinaHungaryIBRD onlyIcelandIDA & IBRD totalIDA blendIDA onlyIDA totalIndiaIndonesiaIran, Islamic Rep.IraqIrelandIsraelItalyJamaicaJapanJordanKazakhstanKenyaKiribatiKorea, Rep.KosovoKuwaitKyrgyz RepublicLao PDRLate-demographic dividendLatin America & Caribbean Latin America & Caribbean (excluding high income)Latin America & the Caribbean (IDA & IBRD countries)LatviaLeast developed countries: UN classificationLebanonLesothoLiberiaLibyaLithuaniaLow & middle incomeLow incomeLower middle incomeLuxembourgMacao SAR, ChinaMacedonia, FYRMadagascarMalawiMalaysiaMaldivesMaliMaltaMarshall IslandsMauritaniaMauritiusMexicoMicronesia, Fed. Sts.Middle East & North AfricaMiddle East & North Africa (excluding high income)Middle East & North Africa (IDA & IBRD countries)Middle incomeMoldovaMongoliaMontenegroMoroccoMozambiqueMyanmarNamibiaNepalNetherlandsNew CaledoniaNew ZealandNicaraguaNigerNigeriaNorth AmericaNorwayOECD membersOmanOther small statesPacific island small statesPakistanPalauPanamaPapua New GuineaParaguayPeruPhilippinesPolandPortugalPost-demographic dividendPre-demographic dividendQatarRomaniaRussian FederationRwandaSamoaSao Tome and PrincipeSaudi ArabiaSenegalSerbiaSeychellesSierra LeoneSingaporeSint Maarten (Dutch part)Slovak RepublicSloveniaSmall statesSolomon IslandsSouth AfricaSouth AsiaSouth Asia (IDA & IBRD)South SudanSpainSri LankaSt. Kitts and NevisSt. LuciaSt. Vincent and the GrenadinesSub-Saharan Africa Sub-Saharan Africa (excluding high income)Sub-Saharan Africa (IDA & IBRD countries)SudanSurinameSwazilandSwedenSwitzerlandSyrian Arab RepublicTajikistanTanzaniaThailandTimor-LesteTogoTongaTrinidad and TobagoTunisiaTurkeyTuvaluUgandaUkraineUnited KingdomUnited StatesUpper middle incomeUruguayVanuatuVenezuela, RBVietnamWest Bank and GazaWorldYemen, Rep.ZambiaZimbabwe Timeline:
This timeline shows a graph from 1978 to 2013 of Ethiopia. No data until 1977. Number of actual observations by date: 36.
Source name:
World Development Indicators
Source organization:
International Monetary Fund, Balance of Payments Statistics Yearbook and data files.
Categories, topics:
Economy & Growth
Last updated:
apr 23, 2017
Indicators value changes by year
Minimum:
59.324 mln
jan 1, 1978
Maximum:
5.327 bln
jan 1, 2013
At the date of observation
Value
Absolute change
Change from previous value
jan 1, 1978
59.324 mln
+59.324 mln
0.0%
jan 1, 1979
86.812 mln
+27.488 mln
46.34%
jan 1, 1980
85.362 mln
-1.449 mln
-1.67%
jan 1, 1981
74.251 mln
-11.111 mln
-13.02%
jan 1, 1982
70.29 mln
-3.961 mln
-5.34%
jan 1, 1983
143.43 mln
+73.14 mln
104.05%
jan 1, 1984
254.251 mln
+110.821 mln
77.27%
jan 1, 1985
332.512 mln
+78.261 mln
30.78%
jan 1, 1986
612.464 mln
+279.952 mln
84.19%
jan 1, 1987
184.203 mln
-428.261 mln
-69.92%
jan 1, 1988
412.85 mln
+228.647 mln
124.13%
jan 1, 1989
443.188 mln
+30.338 mln
7.35%
jan 1, 1990
337.536 mln
-105.652 mln
-23.84%
jan 1, 1991
451.304 mln
+113.768 mln
33.71%
jan 1, 1992
505.903 mln
+54.599 mln
12.1%
jan 1, 1993
887.433 mln
+381.529 mln
75.42%
jan 1, 1994
532.6 mln
-354.833 mln
-39.98%
jan 1, 1995
728.514 mln
+195.914 mln
36.78%
jan 1, 1996
737.294 mln
+8.779 mln
1.21%
jan 1, 1997
678.955 mln
-58.338 mln
-7.91%
jan 1, 1998
425.486 mln
-253.47 mln
-37.33%
jan 1, 1999
589.775 mln
+164.29 mln
38.61%
jan 1, 2000
500.744 mln
-89.031 mln
-15.1%
jan 1, 2001
697.909 mln
+197.165 mln
39.37%
jan 1, 2002
854.283 mln
+156.375 mln
22.41%
jan 1, 2003
876.353 mln
+22.07 mln
2.58%
jan 1, 2004
1.267 bln
+390.148 mln
44.52%
jan 1, 2005
1.421 bln
+154.116 mln
12.17%
jan 1, 2006
1.426 bln
+5.388 mln
0.38%
jan 1, 2007
1.297 bln
-128.778 mln
-9.03%
jan 1, 2008
3.415 bln
+2.118 bln
163.24%
jan 1, 2009
4.344 bln
+928.946 mln
27.2%
jan 1, 2010
3.5 bln
-844.084 mln
-19.43%
jan 1, 2011
4.988 bln
+1.488 bln
42.52%
jan 1, 2012
5.173 bln
+185.03 mln
3.71%
jan 1, 2013
5.327 bln
+153.915 mln
2.98%
Ranking of countries by current statistics by years


Comments: