29
/
en
AIzaSyAYiBZKx7MnpbEhh9jyipgxe19OcubqV5w
April 1, 2024
262975
Thailand
THA
true
2
1
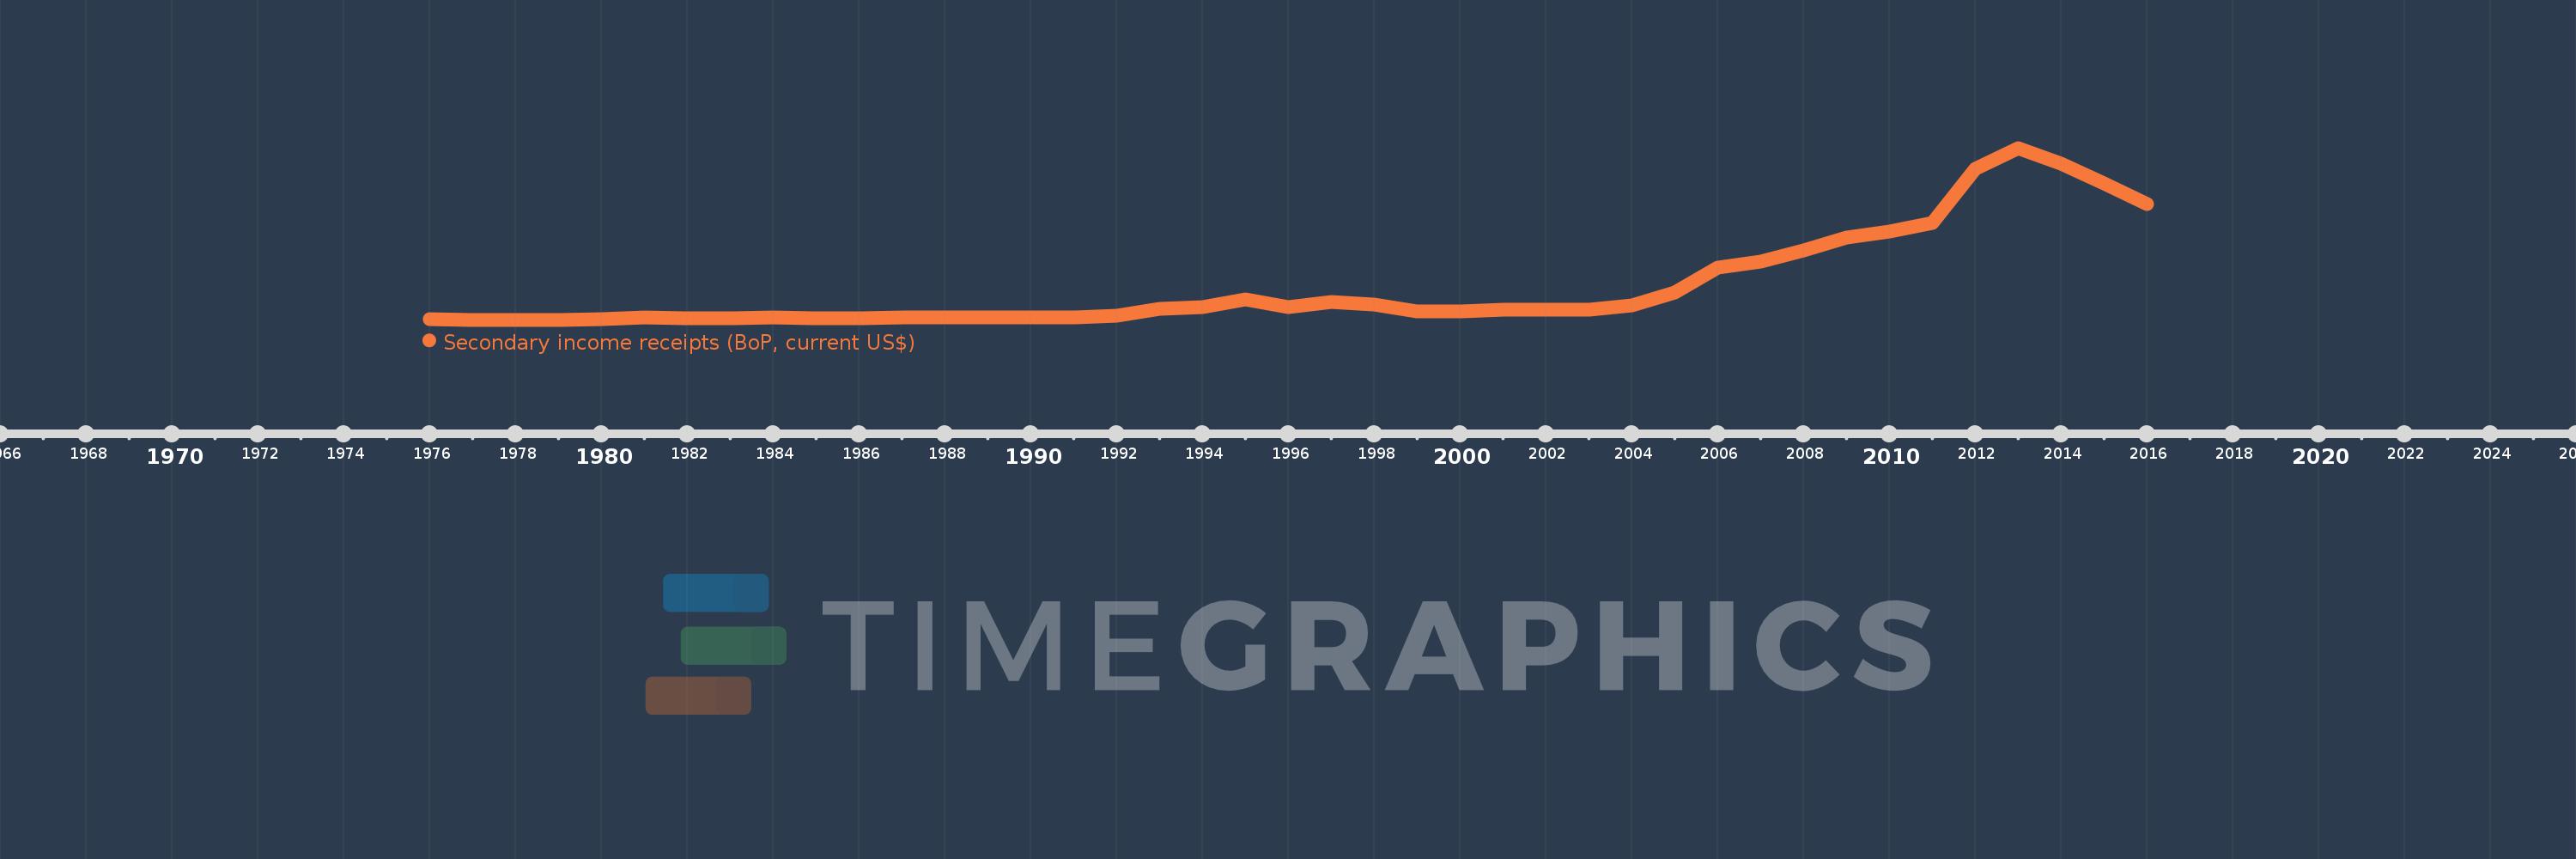
Secondary income receipts (BoP, current US$)
2016,2015,2014,2013,2012,2011,2010,2009,2008,2007,2006,2005,2004,2003,2002,2001,2000,1999,1998,1997,1996,1995,1994,1993,1992,1991,1990,1989,1988,1987,1986,1985,1984,1983,1982,1981,1980,1979,1978,1977,1976
This statistics in other country:
AfghanistanAlbaniaAlgeriaAngolaAntigua and BarbudaArab WorldArgentinaArmeniaArubaAustraliaAustriaAzerbaijanBahamas, TheBahrainBangladeshBarbadosBelarusBelgiumBelizeBeninBermudaBhutanBoliviaBosnia and HerzegovinaBotswanaBrazilBrunei DarussalamBulgariaBurkina FasoBurundiCabo VerdeCambodiaCameroonCanadaCaribbean small statesCentral African RepublicCentral Europe and the BalticsChadChileChinaColombiaComorosCongo, Dem. Rep.Congo, Rep.Costa RicaCote d'IvoireCroatiaCuracaoCyprusCzech RepublicDenmarkDjiboutiDominicaDominican RepublicEarly-demographic dividendEast Asia & PacificEast Asia & Pacific (excluding high income)East Asia & Pacific (IDA & IBRD countries)EcuadorEgypt, Arab Rep.El SalvadorEquatorial GuineaEritreaEstoniaEthiopiaEuro areaEurope & Central AsiaEurope & Central Asia (excluding high income)Europe & Central Asia (IDA & IBRD countries)European UnionFaroe IslandsFijiFinlandFragile and conflict affected situationsFranceFrench PolynesiaGabonGambia, TheGeorgiaGermanyGhanaGreeceGrenadaGuatemalaGuineaGuinea-BissauGuyanaHaitiHeavily indebted poor countries (HIPC)High incomeHondurasHong Kong SAR, ChinaHungaryIBRD onlyIcelandIDA & IBRD totalIDA blendIDA onlyIDA totalIndiaIndonesiaIran, Islamic Rep.IraqIrelandIsraelItalyJamaicaJapanJordanKazakhstanKenyaKiribatiKorea, Rep.KosovoKuwaitKyrgyz RepublicLao PDRLate-demographic dividendLatin America & Caribbean Latin America & Caribbean (excluding high income)Latin America & the Caribbean (IDA & IBRD countries)LatviaLeast developed countries: UN classificationLebanonLesothoLiberiaLibyaLithuaniaLow & middle incomeLow incomeLower middle incomeLuxembourgMacao SAR, ChinaMacedonia, FYRMadagascarMalawiMalaysiaMaldivesMaliMaltaMarshall IslandsMauritaniaMauritiusMexicoMicronesia, Fed. Sts.Middle East & North AfricaMiddle East & North Africa (excluding high income)Middle East & North Africa (IDA & IBRD countries)Middle incomeMoldovaMongoliaMontenegroMoroccoMozambiqueMyanmarNamibiaNepalNetherlandsNew CaledoniaNew ZealandNicaraguaNigerNigeriaNorth AmericaNorwayOECD membersOmanOther small statesPacific island small statesPakistanPalauPanamaPapua New GuineaParaguayPeruPhilippinesPolandPortugalPost-demographic dividendPre-demographic dividendQatarRomaniaRussian FederationRwandaSamoaSao Tome and PrincipeSaudi ArabiaSenegalSerbiaSeychellesSierra LeoneSingaporeSint Maarten (Dutch part)Slovak RepublicSloveniaSmall statesSolomon IslandsSouth AfricaSouth AsiaSouth Asia (IDA & IBRD)South SudanSpainSri LankaSt. Kitts and NevisSt. LuciaSt. Vincent and the GrenadinesSub-Saharan Africa Sub-Saharan Africa (excluding high income)Sub-Saharan Africa (IDA & IBRD countries)SudanSurinameSwazilandSwedenSwitzerlandSyrian Arab RepublicTajikistanTanzaniaThailandTimor-LesteTogoTongaTrinidad and TobagoTunisiaTurkeyTuvaluUgandaUkraineUnited KingdomUnited StatesUpper middle incomeUruguayVanuatuVenezuela, RBVietnamWest Bank and GazaWorldYemen, Rep.ZambiaZimbabwe Timeline:
This timeline shows a graph from 1976 to 2016 of Thailand. No data until 1975. Number of actual observations by date: 41.
Source name:
World Development Indicators
Source organization:
International Monetary Fund, Balance of Payments Statistics Yearbook and data files.
Categories, topics:
Economy & Growth
Last updated:
apr 23, 2017
Indicators value changes by year
Minimum:
51.644 mln
jan 1, 1979
Maximum:
15.563 bln
jan 1, 2013
At the date of observation
Value
Absolute change
Change from previous value
jan 1, 1976
91.024 mln
+91.024 mln
0.0%
jan 1, 1977
59.117 mln
-31.907 mln
-35.05%
jan 1, 1978
52.059 mln
-7.059 mln
-11.94%
jan 1, 1979
51.644 mln
-414.804K
-0.8%
jan 1, 1980
70.912 mln
+19.268 mln
37.31%
jan 1, 1981
228.797 mln
+157.885 mln
222.65%
jan 1, 1982
181.235 mln
-47.561 mln
-20.79%
jan 1, 1983
197.825 mln
+16.59 mln
9.15%
jan 1, 1984
296.477 mln
+98.652 mln
49.87%
jan 1, 1985
193.74 mln
-102.737 mln
-34.65%
jan 1, 1986
190.094 mln
-3.645 mln
-1.88%
jan 1, 1987
250.135 mln
+60.041 mln
31.58%
jan 1, 1988
247.06 mln
-3.075 mln
-1.23%
jan 1, 1989
267.593 mln
+20.533 mln
8.31%
jan 1, 1990
280.57 mln
+12.977 mln
4.85%
jan 1, 1991
278.45 mln
-2.12 mln
-0.76%
jan 1, 1992
410.551 mln
+132.101 mln
47.44%
jan 1, 1993
1.0 bln
+589.699 mln
143.64%
jan 1, 1994
1.222 bln
+222.011 mln
22.2%
jan 1, 1995
1.901 bln
+679.03 mln
55.56%
jan 1, 1996
1.19 bln
-711.078 mln
-37.4%
jan 1, 1997
1.651 bln
+460.821 mln
38.72%
jan 1, 1998
1.392 bln
-258.891 mln
-15.68%
jan 1, 1999
819.792 mln
-572.35 mln
-41.11%
jan 1, 2000
805.609 mln
-14.183 mln
-1.73%
jan 1, 2001
951.584 mln
+145.975 mln
18.12%
jan 1, 2002
990.022 mln
+38.437 mln
4.04%
jan 1, 2003
978.508 mln
-11.513 mln
-1.16%
jan 1, 2004
1.326 bln
+347.159 mln
35.48%
jan 1, 2005
2.479 bln
+1.154 bln
87.03%
jan 1, 2006
4.778 bln
+2.298 bln
92.7%
jan 1, 2007
5.321 bln
+543.19 mln
11.37%
jan 1, 2008
6.279 bln
+958.54 mln
18.01%
jan 1, 2009
7.502 bln
+1.222 bln
19.46%
jan 1, 2010
7.998 bln
+495.96 mln
6.61%
jan 1, 2011
8.812 bln
+814.27 mln
10.18%
jan 1, 2012
13.692 bln
+4.88 bln
55.38%
jan 1, 2013
15.563 bln
+1.871 bln
13.66%
jan 1, 2014
14.18 bln
-1.382 bln
-8.88%
jan 1, 2015
12.373 bln
-1.807 bln
-12.75%
jan 1, 2016
10.468 bln
-1.905 bln
-15.39%
Ranking of countries by current statistics by years


Comments: