29
/
en
AIzaSyAYiBZKx7MnpbEhh9jyipgxe19OcubqV5w
April 1, 2024
73435
Australia
AUS
true
2
1
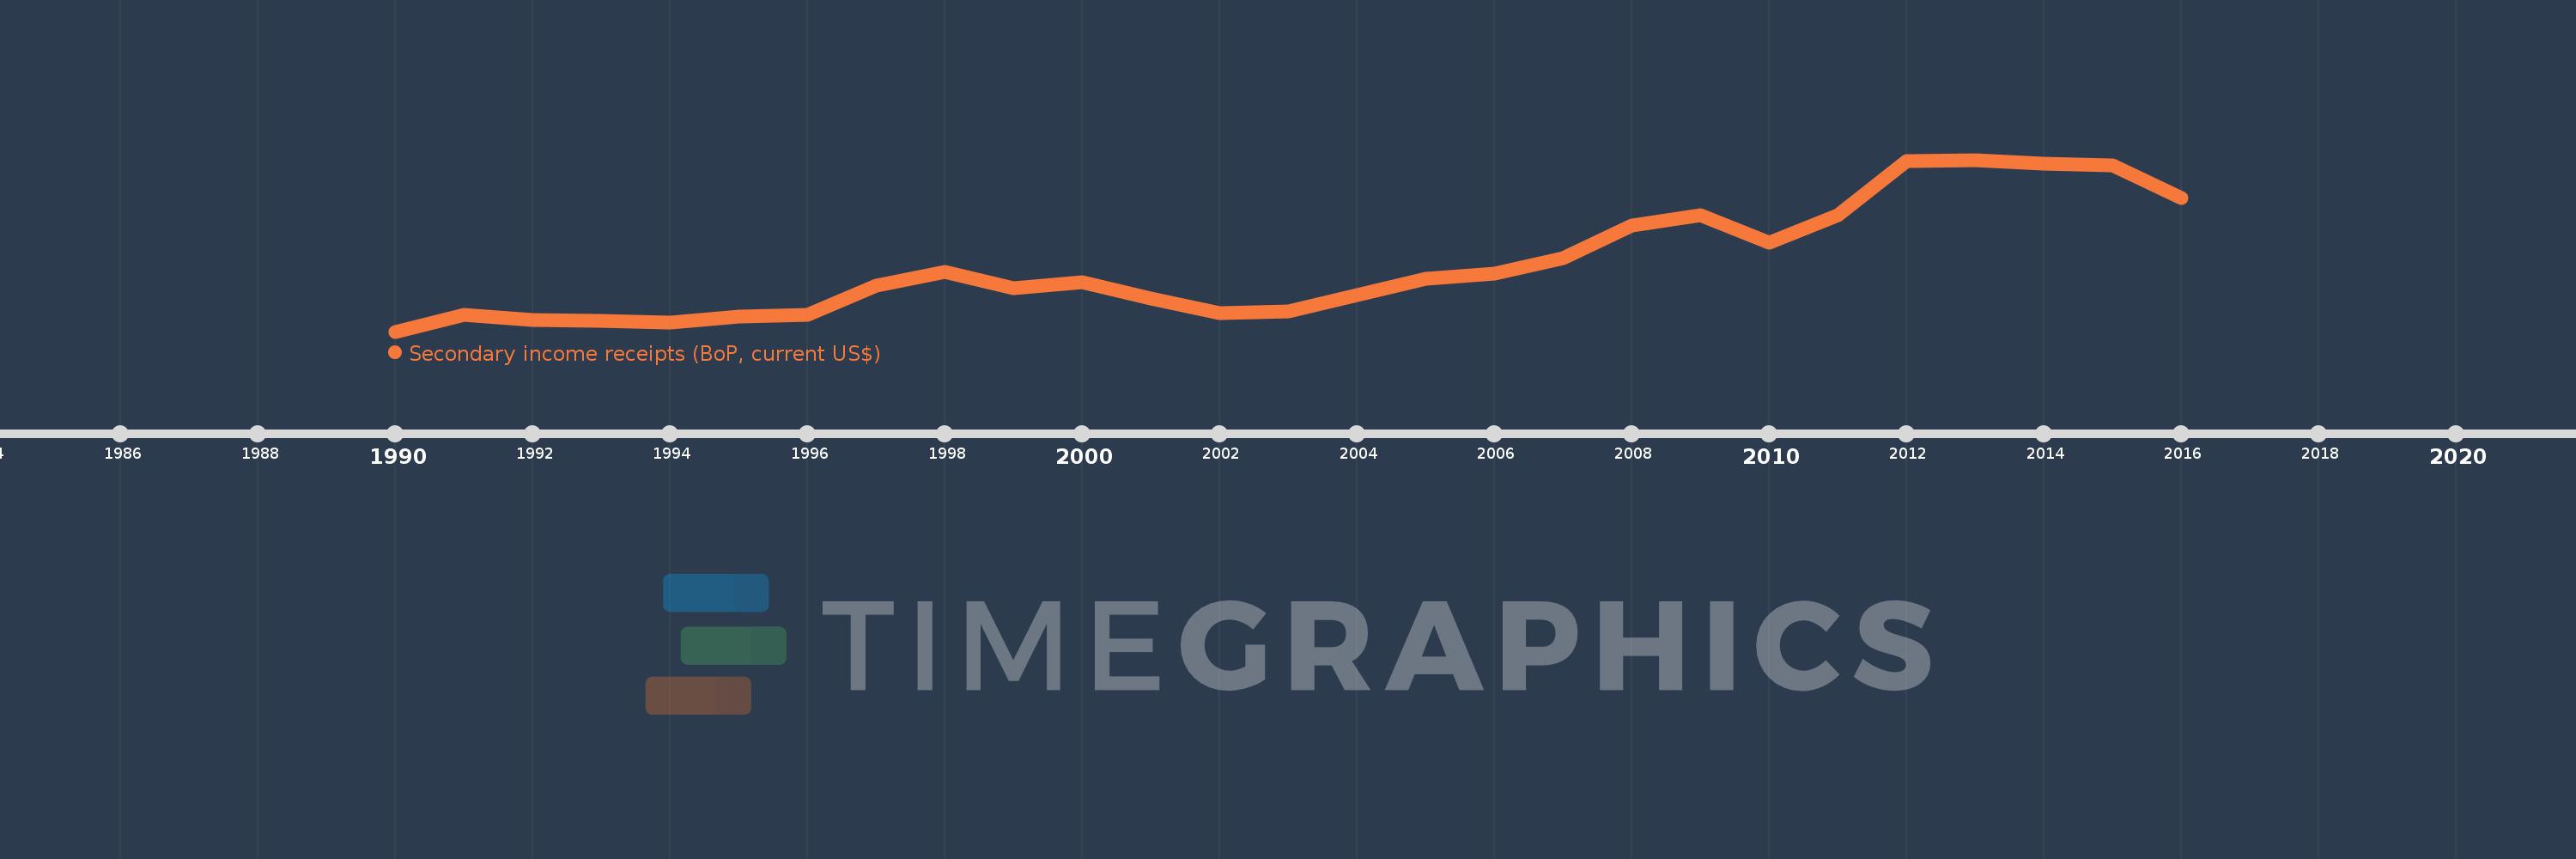
Secondary income receipts (BoP, current US$)
2016,2015,2014,2013,2012,2011,2010,2009,2008,2007,2006,2005,2004,2003,2002,2001,2000,1999,1998,1997,1996,1995,1994,1993,1992,1991,1990
This statistics in other country:
AfghanistanAlbaniaAlgeriaAngolaAntigua and BarbudaArab WorldArgentinaArmeniaArubaAustraliaAustriaAzerbaijanBahamas, TheBahrainBangladeshBarbadosBelarusBelgiumBelizeBeninBermudaBhutanBoliviaBosnia and HerzegovinaBotswanaBrazilBrunei DarussalamBulgariaBurkina FasoBurundiCabo VerdeCambodiaCameroonCanadaCaribbean small statesCentral African RepublicCentral Europe and the BalticsChadChileChinaColombiaComorosCongo, Dem. Rep.Congo, Rep.Costa RicaCote d'IvoireCroatiaCuracaoCyprusCzech RepublicDenmarkDjiboutiDominicaDominican RepublicEarly-demographic dividendEast Asia & PacificEast Asia & Pacific (excluding high income)East Asia & Pacific (IDA & IBRD countries)EcuadorEgypt, Arab Rep.El SalvadorEquatorial GuineaEritreaEstoniaEthiopiaEuro areaEurope & Central AsiaEurope & Central Asia (excluding high income)Europe & Central Asia (IDA & IBRD countries)European UnionFaroe IslandsFijiFinlandFragile and conflict affected situationsFranceFrench PolynesiaGabonGambia, TheGeorgiaGermanyGhanaGreeceGrenadaGuatemalaGuineaGuinea-BissauGuyanaHaitiHeavily indebted poor countries (HIPC)High incomeHondurasHong Kong SAR, ChinaHungaryIBRD onlyIcelandIDA & IBRD totalIDA blendIDA onlyIDA totalIndiaIndonesiaIran, Islamic Rep.IraqIrelandIsraelItalyJamaicaJapanJordanKazakhstanKenyaKiribatiKorea, Rep.KosovoKuwaitKyrgyz RepublicLao PDRLate-demographic dividendLatin America & Caribbean Latin America & Caribbean (excluding high income)Latin America & the Caribbean (IDA & IBRD countries)LatviaLeast developed countries: UN classificationLebanonLesothoLiberiaLibyaLithuaniaLow & middle incomeLow incomeLower middle incomeLuxembourgMacao SAR, ChinaMacedonia, FYRMadagascarMalawiMalaysiaMaldivesMaliMaltaMarshall IslandsMauritaniaMauritiusMexicoMicronesia, Fed. Sts.Middle East & North AfricaMiddle East & North Africa (excluding high income)Middle East & North Africa (IDA & IBRD countries)Middle incomeMoldovaMongoliaMontenegroMoroccoMozambiqueMyanmarNamibiaNepalNetherlandsNew CaledoniaNew ZealandNicaraguaNigerNigeriaNorth AmericaNorwayOECD membersOmanOther small statesPacific island small statesPakistanPalauPanamaPapua New GuineaParaguayPeruPhilippinesPolandPortugalPost-demographic dividendPre-demographic dividendQatarRomaniaRussian FederationRwandaSamoaSao Tome and PrincipeSaudi ArabiaSenegalSerbiaSeychellesSierra LeoneSingaporeSint Maarten (Dutch part)Slovak RepublicSloveniaSmall statesSolomon IslandsSouth AfricaSouth AsiaSouth Asia (IDA & IBRD)South SudanSpainSri LankaSt. Kitts and NevisSt. LuciaSt. Vincent and the GrenadinesSub-Saharan Africa Sub-Saharan Africa (excluding high income)Sub-Saharan Africa (IDA & IBRD countries)SudanSurinameSwazilandSwedenSwitzerlandSyrian Arab RepublicTajikistanTanzaniaThailandTimor-LesteTogoTongaTrinidad and TobagoTunisiaTurkeyTuvaluUgandaUkraineUnited KingdomUnited StatesUpper middle incomeUruguayVanuatuVenezuela, RBVietnamWest Bank and GazaWorldYemen, Rep.ZambiaZimbabwe Timeline:
This timeline shows a graph from 1990 to 2016 of Australia. No data until 1989. Number of actual observations by date: 27.
Source name:
World Development Indicators
Source organization:
International Monetary Fund, Balance of Payments Statistics Yearbook and data files.
Categories, topics:
Economy & Growth
Last updated:
apr 23, 2017
Indicators value changes by year
Minimum:
2.298 bln
jan 1, 1990
Maximum:
7.572 bln
jan 1, 2013
At the date of observation
Value
Absolute change
Change from previous value
jan 1, 1990
2.298 bln
+2.298 bln
0.0%
jan 1, 1991
2.801 bln
+502.541 mln
21.87%
jan 1, 1992
2.648 bln
-152.586 mln
-5.45%
jan 1, 1993
2.634 bln
-13.97 mln
-0.53%
jan 1, 1994
2.573 bln
-60.835 mln
-2.31%
jan 1, 1995
2.748 bln
+174.464 mln
6.78%
jan 1, 1996
2.824 bln
+76.163 mln
2.77%
jan 1, 1997
3.72 bln
+896.664 mln
31.75%
jan 1, 1998
4.137 bln
+416.505 mln
11.19%
jan 1, 1999
3.627 bln
-510.391 mln
-12.34%
jan 1, 2000
3.816 bln
+189.797 mln
5.23%
jan 1, 2001
3.304 bln
-512.313 mln
-13.42%
jan 1, 2002
2.861 bln
-442.881 mln
-13.4%
jan 1, 2003
2.905 bln
+44.046 mln
1.54%
jan 1, 2004
3.414 bln
+508.397 mln
17.5%
jan 1, 2005
3.91 bln
+496.162 mln
14.53%
jan 1, 2006
4.078 bln
+168.568 mln
4.31%
jan 1, 2007
4.558 bln
+479.924 mln
11.77%
jan 1, 2008
5.553 bln
+995.017 mln
21.83%
jan 1, 2009
5.862 bln
+308.417 mln
5.55%
jan 1, 2010
5.038 bln
-823.469 mln
-14.05%
jan 1, 2011
5.864 bln
+825.259 mln
16.38%
jan 1, 2012
7.524 bln
+1.661 bln
28.32%
jan 1, 2013
7.572 bln
+48.044 mln
0.64%
jan 1, 2014
7.454 bln
-118.504 mln
-1.56%
jan 1, 2015
7.413 bln
-40.714 mln
-0.55%
jan 1, 2016
6.406 bln
-1.007 bln
-13.59%
Ranking of countries by current statistics by years


Comments: