29
/
en
AIzaSyAYiBZKx7MnpbEhh9jyipgxe19OcubqV5w
April 1, 2024
40337
IDA total
IDA
false
2
1
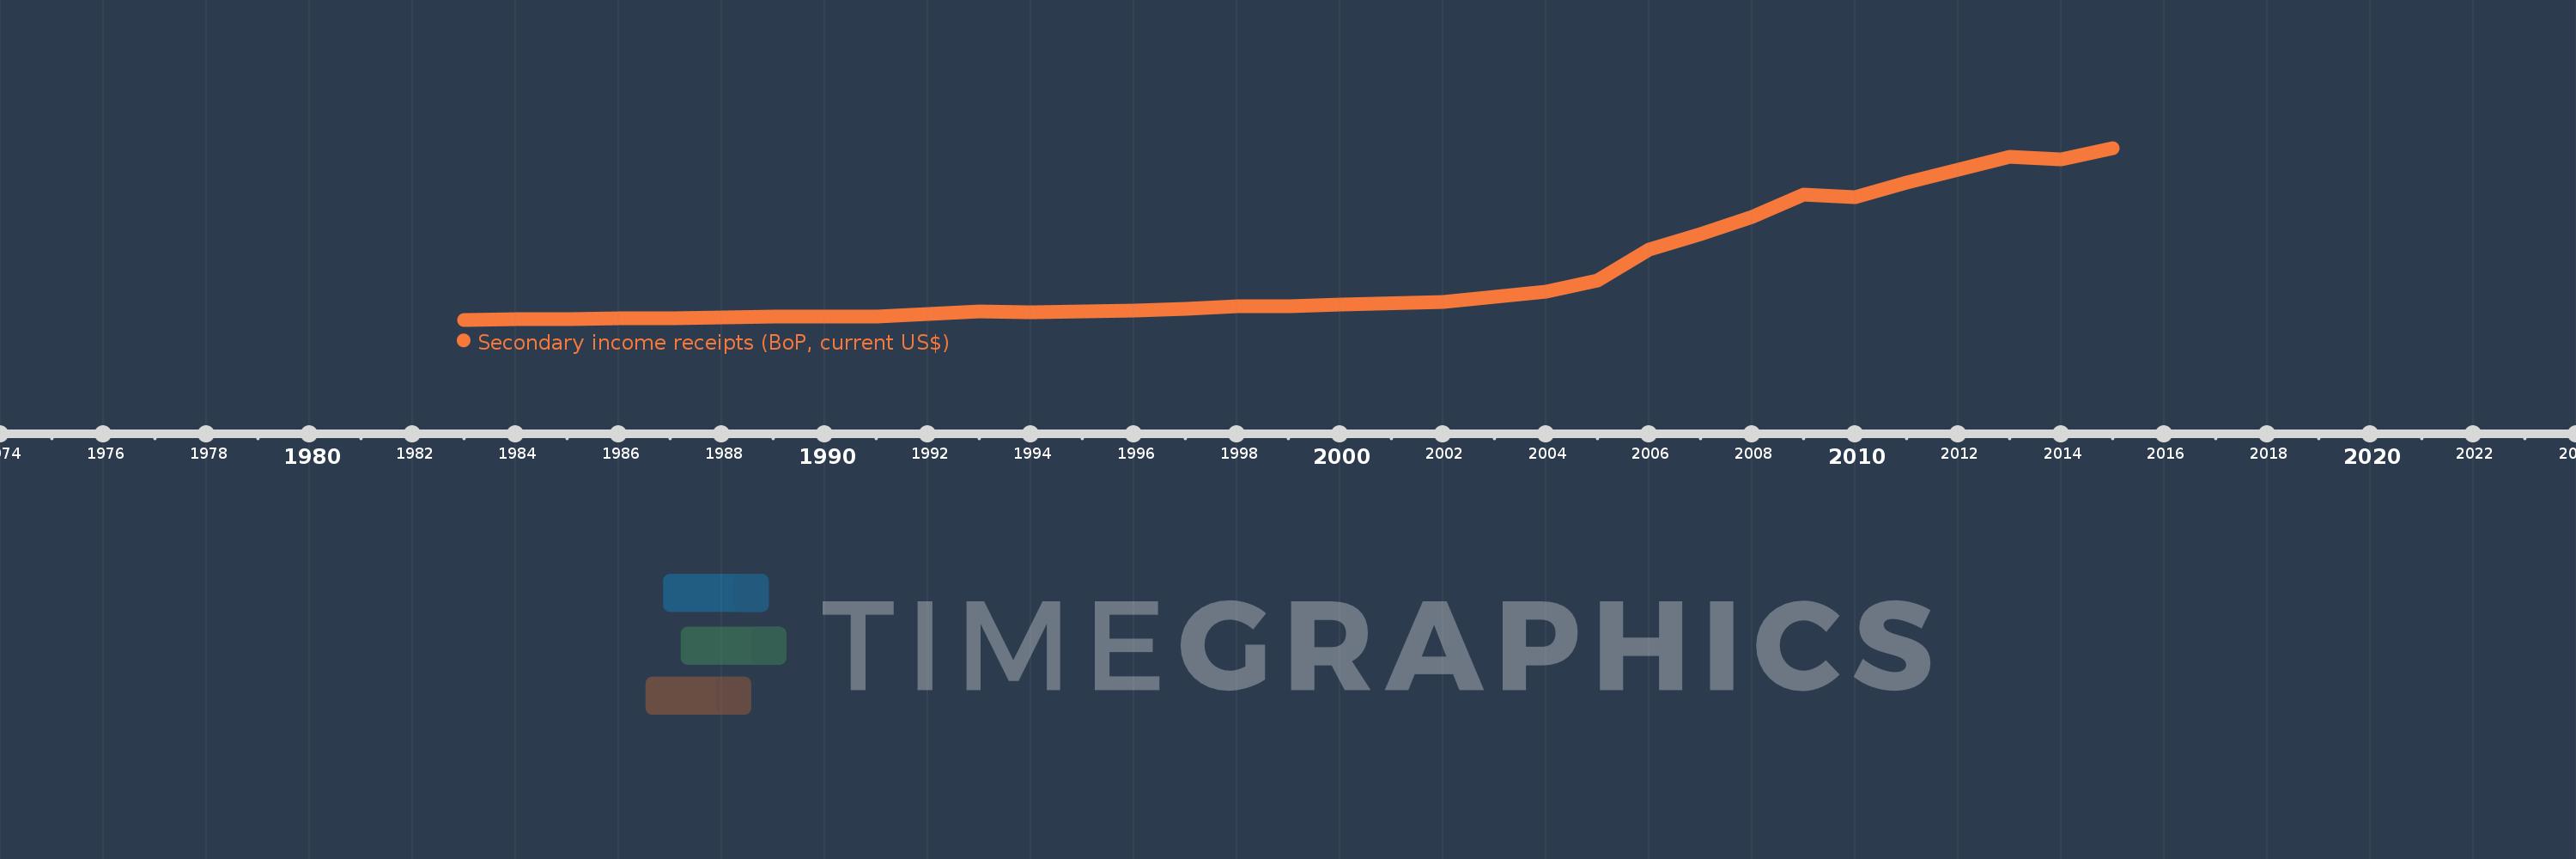
Secondary income receipts (BoP, current US$)
2015,2014,2013,2012,2011,2010,2009,2008,2007,2006,2005,2004,2003,2002,2000,1999,1998,1997,1996,1995,1994,1993,1992,1991,1990,1989,1988,1987,1986,1985,1984,1983
This statistics in other country:
AfghanistanAlbaniaAlgeriaAngolaAntigua and BarbudaArab WorldArgentinaArmeniaArubaAustraliaAustriaAzerbaijanBahamas, TheBahrainBangladeshBarbadosBelarusBelgiumBelizeBeninBermudaBhutanBoliviaBosnia and HerzegovinaBotswanaBrazilBrunei DarussalamBulgariaBurkina FasoBurundiCabo VerdeCambodiaCameroonCanadaCaribbean small statesCentral African RepublicCentral Europe and the BalticsChadChileChinaColombiaComorosCongo, Dem. Rep.Congo, Rep.Costa RicaCote d'IvoireCroatiaCuracaoCyprusCzech RepublicDenmarkDjiboutiDominicaDominican RepublicEarly-demographic dividendEast Asia & PacificEast Asia & Pacific (excluding high income)East Asia & Pacific (IDA & IBRD countries)EcuadorEgypt, Arab Rep.El SalvadorEquatorial GuineaEritreaEstoniaEthiopiaEuro areaEurope & Central AsiaEurope & Central Asia (excluding high income)Europe & Central Asia (IDA & IBRD countries)European UnionFaroe IslandsFijiFinlandFragile and conflict affected situationsFranceFrench PolynesiaGabonGambia, TheGeorgiaGermanyGhanaGreeceGrenadaGuatemalaGuineaGuinea-BissauGuyanaHaitiHeavily indebted poor countries (HIPC)High incomeHondurasHong Kong SAR, ChinaHungaryIBRD onlyIcelandIDA & IBRD totalIDA blendIDA onlyIDA totalIndiaIndonesiaIran, Islamic Rep.IraqIrelandIsraelItalyJamaicaJapanJordanKazakhstanKenyaKiribatiKorea, Rep.KosovoKuwaitKyrgyz RepublicLao PDRLate-demographic dividendLatin America & Caribbean Latin America & Caribbean (excluding high income)Latin America & the Caribbean (IDA & IBRD countries)LatviaLeast developed countries: UN classificationLebanonLesothoLiberiaLibyaLithuaniaLow & middle incomeLow incomeLower middle incomeLuxembourgMacao SAR, ChinaMacedonia, FYRMadagascarMalawiMalaysiaMaldivesMaliMaltaMarshall IslandsMauritaniaMauritiusMexicoMicronesia, Fed. Sts.Middle East & North AfricaMiddle East & North Africa (excluding high income)Middle East & North Africa (IDA & IBRD countries)Middle incomeMoldovaMongoliaMontenegroMoroccoMozambiqueMyanmarNamibiaNepalNetherlandsNew CaledoniaNew ZealandNicaraguaNigerNigeriaNorth AmericaNorwayOECD membersOmanOther small statesPacific island small statesPakistanPalauPanamaPapua New GuineaParaguayPeruPhilippinesPolandPortugalPost-demographic dividendPre-demographic dividendQatarRomaniaRussian FederationRwandaSamoaSao Tome and PrincipeSaudi ArabiaSenegalSerbiaSeychellesSierra LeoneSingaporeSint Maarten (Dutch part)Slovak RepublicSloveniaSmall statesSolomon IslandsSouth AfricaSouth AsiaSouth Asia (IDA & IBRD)South SudanSpainSri LankaSt. Kitts and NevisSt. LuciaSt. Vincent and the GrenadinesSub-Saharan Africa Sub-Saharan Africa (excluding high income)Sub-Saharan Africa (IDA & IBRD countries)SudanSurinameSwazilandSwedenSwitzerlandSyrian Arab RepublicTajikistanTanzaniaThailandTimor-LesteTogoTongaTrinidad and TobagoTunisiaTurkeyTuvaluUgandaUkraineUnited KingdomUnited StatesUpper middle incomeUruguayVanuatuVenezuela, RBVietnamWest Bank and GazaWorldYemen, Rep.ZambiaZimbabwe Timeline:
This timeline shows a graph from 1983 to 2015 of IDA total. No data until 1982. Number of actual observations by date: 32.
Source name:
World Development Indicators
Source organization:
International Monetary Fund, Balance of Payments Statistics Yearbook and data files.
Categories, topics:
Economy & Growth
Last updated:
apr 23, 2017
Indicators value changes by year
Minimum:
10.228 bln
jan 1, 1983
Maximum:
144.463 bln
jan 1, 2015
At the date of observation
Value
Absolute change
Change from previous value
jan 1, 1983
10.228 bln
+10.228 bln
0.0%
jan 1, 1984
10.959 bln
+730.725 mln
7.14%
jan 1, 1985
10.898 bln
-60.87 mln
-0.56%
jan 1, 1986
11.328 bln
+429.966 mln
3.95%
jan 1, 1987
11.082 bln
-246.279 mln
-2.17%
jan 1, 1988
12.197 bln
+1.116 bln
10.07%
jan 1, 1989
12.902 bln
+704.797 mln
5.78%
jan 1, 1990
12.818 bln
-83.764 mln
-0.65%
jan 1, 1991
12.882 bln
+63.441 mln
0.49%
jan 1, 1992
14.865 bln
+1.983 bln
15.4%
jan 1, 1993
16.905 bln
+2.039 bln
13.72%
jan 1, 1994
16.048 bln
-856.259 mln
-5.07%
jan 1, 1995
17.047 bln
+999.009 mln
6.23%
jan 1, 1996
17.269 bln
+222.156 mln
1.3%
jan 1, 1997
18.52 bln
+1.251 bln
7.24%
jan 1, 1998
20.584 bln
+2.063 bln
11.14%
jan 1, 1999
20.898 bln
+314.382 mln
1.53%
jan 1, 2000
21.8 bln
+902.074 mln
4.32%
jan 1, 2002
24.022 bln
+2.222 bln
10.19%
jan 1, 2003
28.254 bln
+4.232 bln
17.62%
jan 1, 2004
31.859 bln
+3.605 bln
12.76%
jan 1, 2005
40.699 bln
+8.841 bln
27.75%
jan 1, 2006
64.947 bln
+24.247 bln
59.58%
jan 1, 2007
77.213 bln
+12.266 bln
18.89%
jan 1, 2008
90.537 bln
+13.324 bln
17.26%
jan 1, 2009
107.871 bln
+17.334 bln
19.15%
jan 1, 2010
106.317 bln
-1.553 bln
-1.44%
jan 1, 2011
117.227 bln
+10.909 bln
10.26%
jan 1, 2012
127.184 bln
+9.957 bln
8.49%
jan 1, 2013
137.656 bln
+10.472 bln
8.23%
jan 1, 2014
135.793 bln
-1.863 bln
-1.35%
jan 1, 2015
144.463 bln
+8.67 bln
6.38%
Ranking of countries by current statistics by years


Comments: