29
/
en
AIzaSyAYiBZKx7MnpbEhh9jyipgxe19OcubqV5w
April 1, 2024
277117
United States
USA
true
2
1
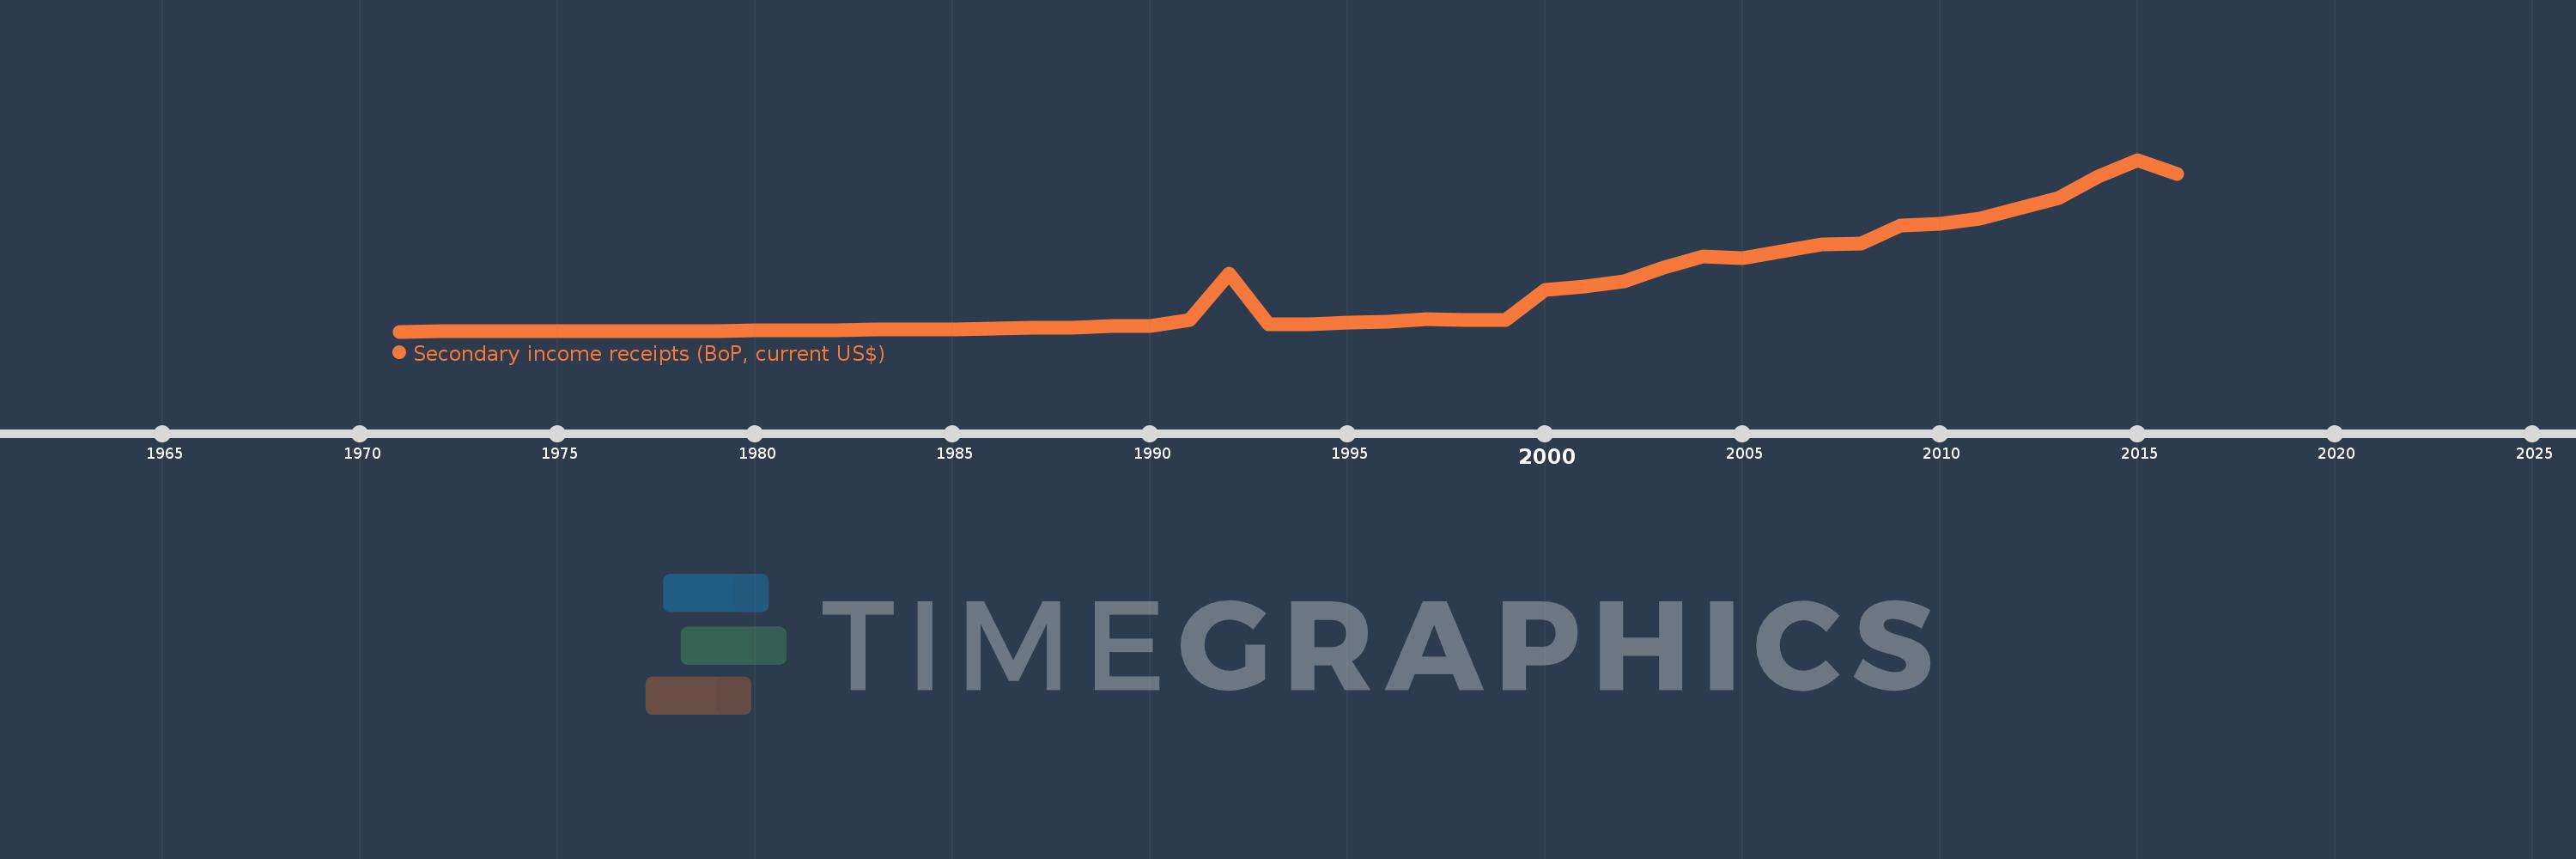
Secondary income receipts (BoP, current US$)
2016,2015,2014,2013,2012,2011,2010,2009,2008,2007,2006,2005,2004,2003,2002,2001,2000,1999,1998,1997,1996,1995,1994,1993,1992,1991,1990,1989,1988,1987,1986,1985,1984,1983,1982,1981,1980,1979,1978,1977,1976,1975,1974,1973,1972,1971
This statistics in other country:
AfghanistanAlbaniaAlgeriaAngolaAntigua and BarbudaArab WorldArgentinaArmeniaArubaAustraliaAustriaAzerbaijanBahamas, TheBahrainBangladeshBarbadosBelarusBelgiumBelizeBeninBermudaBhutanBoliviaBosnia and HerzegovinaBotswanaBrazilBrunei DarussalamBulgariaBurkina FasoBurundiCabo VerdeCambodiaCameroonCanadaCaribbean small statesCentral African RepublicCentral Europe and the BalticsChadChileChinaColombiaComorosCongo, Dem. Rep.Congo, Rep.Costa RicaCote d'IvoireCroatiaCuracaoCyprusCzech RepublicDenmarkDjiboutiDominicaDominican RepublicEarly-demographic dividendEast Asia & PacificEast Asia & Pacific (excluding high income)East Asia & Pacific (IDA & IBRD countries)EcuadorEgypt, Arab Rep.El SalvadorEquatorial GuineaEritreaEstoniaEthiopiaEuro areaEurope & Central AsiaEurope & Central Asia (excluding high income)Europe & Central Asia (IDA & IBRD countries)European UnionFaroe IslandsFijiFinlandFragile and conflict affected situationsFranceFrench PolynesiaGabonGambia, TheGeorgiaGermanyGhanaGreeceGrenadaGuatemalaGuineaGuinea-BissauGuyanaHaitiHeavily indebted poor countries (HIPC)High incomeHondurasHong Kong SAR, ChinaHungaryIBRD onlyIcelandIDA & IBRD totalIDA blendIDA onlyIDA totalIndiaIndonesiaIran, Islamic Rep.IraqIrelandIsraelItalyJamaicaJapanJordanKazakhstanKenyaKiribatiKorea, Rep.KosovoKuwaitKyrgyz RepublicLao PDRLate-demographic dividendLatin America & Caribbean Latin America & Caribbean (excluding high income)Latin America & the Caribbean (IDA & IBRD countries)LatviaLeast developed countries: UN classificationLebanonLesothoLiberiaLibyaLithuaniaLow & middle incomeLow incomeLower middle incomeLuxembourgMacao SAR, ChinaMacedonia, FYRMadagascarMalawiMalaysiaMaldivesMaliMaltaMarshall IslandsMauritaniaMauritiusMexicoMicronesia, Fed. Sts.Middle East & North AfricaMiddle East & North Africa (excluding high income)Middle East & North Africa (IDA & IBRD countries)Middle incomeMoldovaMongoliaMontenegroMoroccoMozambiqueMyanmarNamibiaNepalNetherlandsNew CaledoniaNew ZealandNicaraguaNigerNigeriaNorth AmericaNorwayOECD membersOmanOther small statesPacific island small statesPakistanPalauPanamaPapua New GuineaParaguayPeruPhilippinesPolandPortugalPost-demographic dividendPre-demographic dividendQatarRomaniaRussian FederationRwandaSamoaSao Tome and PrincipeSaudi ArabiaSenegalSerbiaSeychellesSierra LeoneSingaporeSint Maarten (Dutch part)Slovak RepublicSloveniaSmall statesSolomon IslandsSouth AfricaSouth AsiaSouth Asia (IDA & IBRD)South SudanSpainSri LankaSt. Kitts and NevisSt. LuciaSt. Vincent and the GrenadinesSub-Saharan Africa Sub-Saharan Africa (excluding high income)Sub-Saharan Africa (IDA & IBRD countries)SudanSurinameSwazilandSwedenSwitzerlandSyrian Arab RepublicTajikistanTanzaniaThailandTimor-LesteTogoTongaTrinidad and TobagoTunisiaTurkeyTuvaluUgandaUkraineUnited KingdomUnited StatesUpper middle incomeUruguayVanuatuVenezuela, RBVietnamWest Bank and GazaWorldYemen, Rep.ZambiaZimbabwe Timeline:
This timeline shows a graph from 1971 to 2016 of United States. No data until 1970. Number of actual observations by date: 46.
Source name:
World Development Indicators
Source organization:
International Monetary Fund, Balance of Payments Statistics Yearbook and data files.
Categories, topics:
Economy & Growth
Last updated:
apr 23, 2017
Indicators value changes by year
Minimum:
380.0 mln
jan 1, 1971
Maximum:
140.373 bln
jan 1, 2015
At the date of observation
Value
Absolute change
Change from previous value
jan 1, 1971
380.0 mln
+380.0 mln
0.0%
jan 1, 1972
400.0 mln
+20.0 mln
5.26%
jan 1, 1973
610.0 mln
+210.0 mln
52.5%
jan 1, 1974
700.0 mln
+90.0 mln
14.75%
jan 1, 1975
720.0 mln
+20.0 mln
2.86%
jan 1, 1976
720.0 mln
0.0
0.0%
jan 1, 1977
760.0 mln
+40.0 mln
5.56%
jan 1, 1978
700.0 mln
-60.0 mln
-7.89%
jan 1, 1979
810.0 mln
+110.0 mln
15.71%
jan 1, 1980
1.14 bln
+330.0 mln
40.74%
jan 1, 1981
1.32 bln
+180.0 mln
15.79%
jan 1, 1982
1.23 bln
-90.0 mln
-6.82%
jan 1, 1983
2.04 bln
+810.0 mln
65.85%
jan 1, 1984
2.01 bln
-30.0 mln
-1.47%
jan 1, 1985
2.16 bln
+150.0 mln
7.46%
jan 1, 1986
2.5 bln
+340.0 mln
15.74%
jan 1, 1987
3.409 bln
+909.0 mln
36.36%
jan 1, 1988
3.866 bln
+457.0 mln
13.41%
jan 1, 1989
4.629 bln
+763.0 mln
19.74%
jan 1, 1990
5.08 bln
+451.0 mln
9.74%
jan 1, 1991
10.04 bln
+4.96 bln
97.64%
jan 1, 1992
47.85 bln
+37.81 bln
376.59%
jan 1, 1993
6.542 bln
-41.308 bln
-86.33%
jan 1, 1994
6.667 bln
+125.3 mln
1.92%
jan 1, 1995
7.986 bln
+1.319 bln
19.79%
jan 1, 1996
8.626 bln
+639.7 mln
8.01%
jan 1, 1997
10.401 bln
+1.775 bln
20.58%
jan 1, 1998
9.892 bln
-509.1 mln
-4.89%
jan 1, 1999
9.636 bln
-255.9 mln
-2.59%
jan 1, 2000
34.389 bln
+24.753 bln
256.89%
jan 1, 2001
37.391 bln
+3.002 bln
8.73%
jan 1, 2002
41.307 bln
+3.916 bln
10.47%
jan 1, 2003
52.579 bln
+11.272 bln
27.29%
jan 1, 2004
61.937 bln
+9.358 bln
17.8%
jan 1, 2005
60.152 bln
-1.785 bln
-2.88%
jan 1, 2006
65.979 bln
+5.827 bln
9.69%
jan 1, 2007
71.394 bln
+5.415 bln
8.21%
jan 1, 2008
71.91 bln
+516.0 mln
0.72%
jan 1, 2009
86.629 bln
+14.719 bln
20.47%
jan 1, 2010
88.49 bln
+1.861 bln
2.15%
jan 1, 2011
92.278 bln
+3.788 bln
4.28%
jan 1, 2012
100.823 bln
+8.545 bln
9.26%
jan 1, 2013
109.119 bln
+8.296 bln
8.23%
jan 1, 2014
126.687 bln
+17.568 bln
16.1%
jan 1, 2015
140.373 bln
+13.686 bln
10.8%
jan 1, 2016
128.613 bln
-11.76 bln
-8.38%
Ranking of countries by current statistics by years


Comments: