29
/
en
AIzaSyAYiBZKx7MnpbEhh9jyipgxe19OcubqV5w
April 1, 2024
156713
Indonesia
IDN
true
2
1
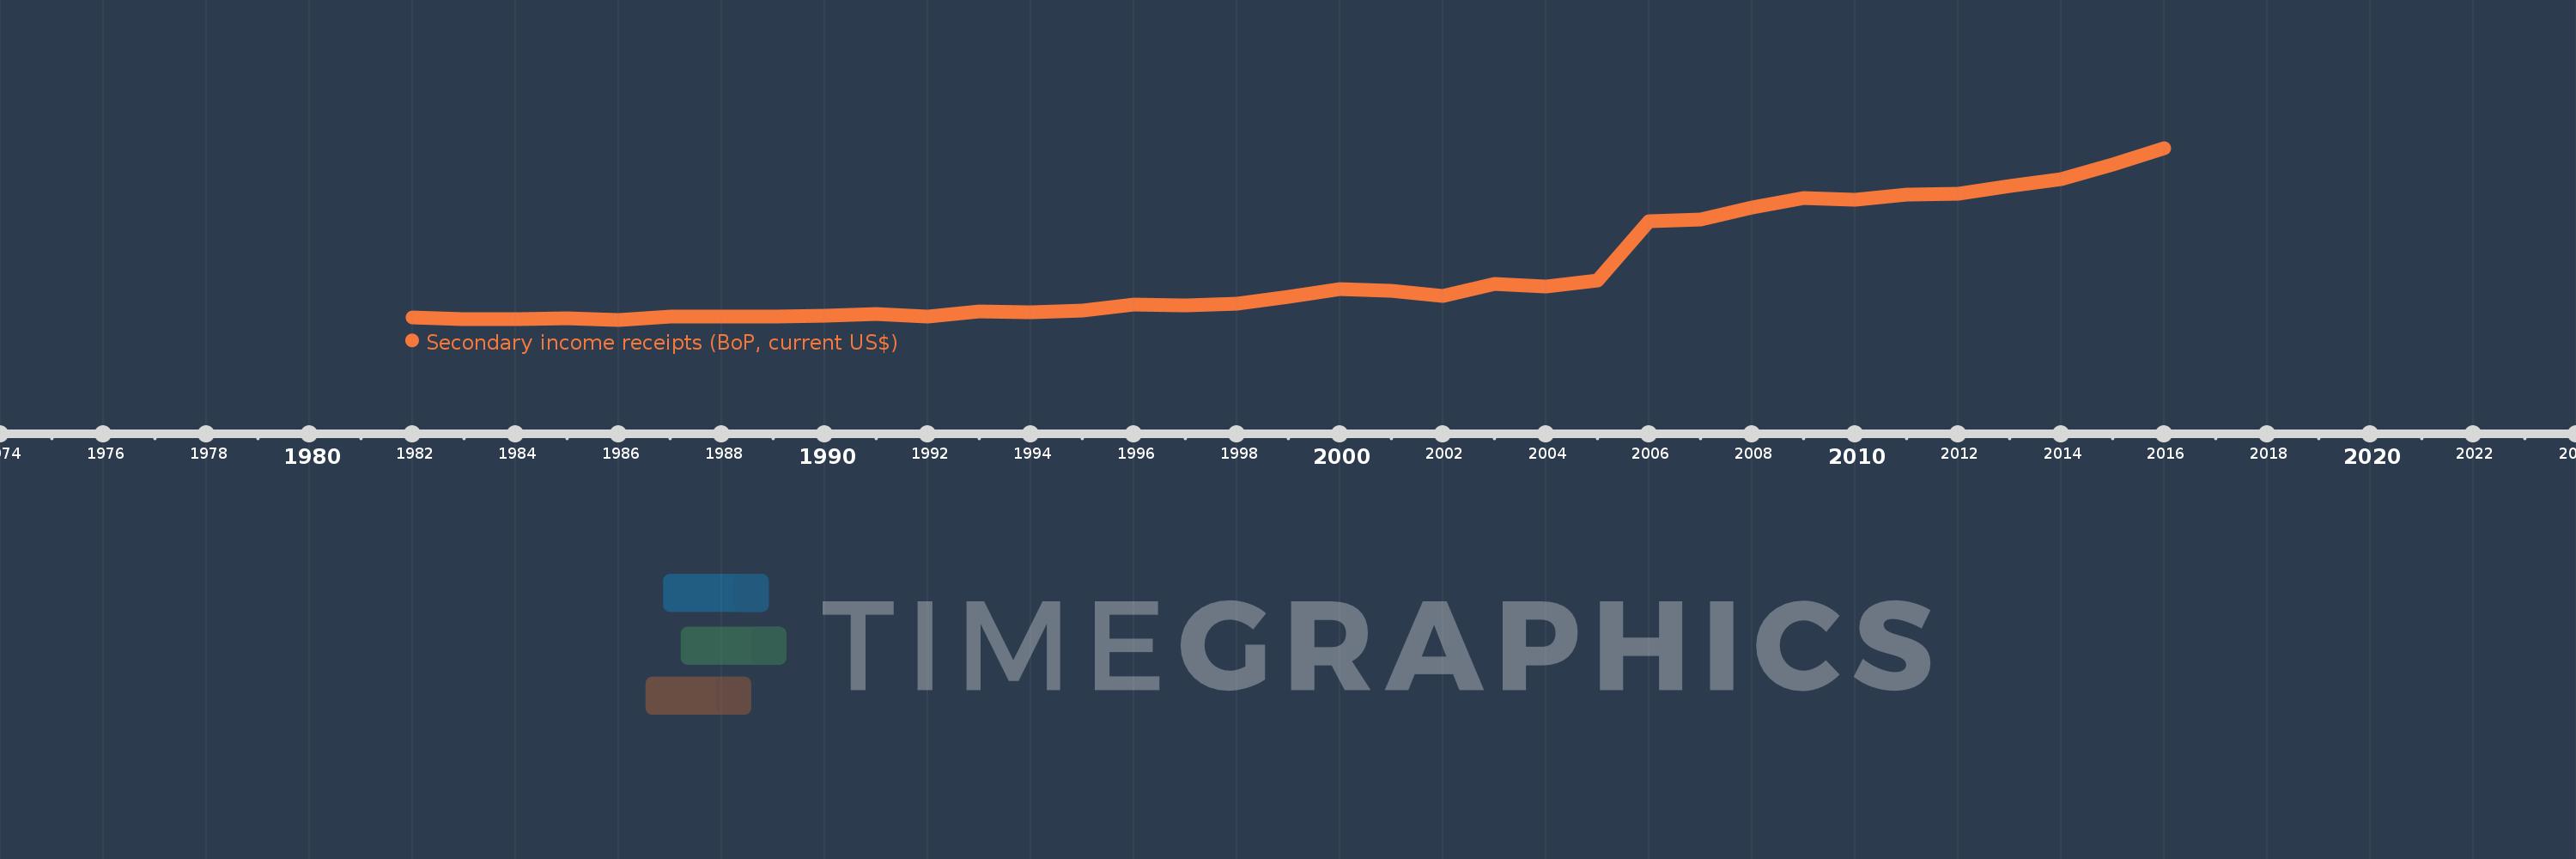
Secondary income receipts (BoP, current US$)
2016,2015,2014,2013,2012,2011,2010,2009,2008,2007,2006,2005,2004,2003,2002,2001,2000,1999,1998,1997,1996,1995,1994,1993,1992,1991,1990,1989,1988,1987,1986,1985,1984,1983,1982
This statistics in other country:
AfghanistanAlbaniaAlgeriaAngolaAntigua and BarbudaArab WorldArgentinaArmeniaArubaAustraliaAustriaAzerbaijanBahamas, TheBahrainBangladeshBarbadosBelarusBelgiumBelizeBeninBermudaBhutanBoliviaBosnia and HerzegovinaBotswanaBrazilBrunei DarussalamBulgariaBurkina FasoBurundiCabo VerdeCambodiaCameroonCanadaCaribbean small statesCentral African RepublicCentral Europe and the BalticsChadChileChinaColombiaComorosCongo, Dem. Rep.Congo, Rep.Costa RicaCote d'IvoireCroatiaCuracaoCyprusCzech RepublicDenmarkDjiboutiDominicaDominican RepublicEarly-demographic dividendEast Asia & PacificEast Asia & Pacific (excluding high income)East Asia & Pacific (IDA & IBRD countries)EcuadorEgypt, Arab Rep.El SalvadorEquatorial GuineaEritreaEstoniaEthiopiaEuro areaEurope & Central AsiaEurope & Central Asia (excluding high income)Europe & Central Asia (IDA & IBRD countries)European UnionFaroe IslandsFijiFinlandFragile and conflict affected situationsFranceFrench PolynesiaGabonGambia, TheGeorgiaGermanyGhanaGreeceGrenadaGuatemalaGuineaGuinea-BissauGuyanaHaitiHeavily indebted poor countries (HIPC)High incomeHondurasHong Kong SAR, ChinaHungaryIBRD onlyIcelandIDA & IBRD totalIDA blendIDA onlyIDA totalIndiaIndonesiaIran, Islamic Rep.IraqIrelandIsraelItalyJamaicaJapanJordanKazakhstanKenyaKiribatiKorea, Rep.KosovoKuwaitKyrgyz RepublicLao PDRLate-demographic dividendLatin America & Caribbean Latin America & Caribbean (excluding high income)Latin America & the Caribbean (IDA & IBRD countries)LatviaLeast developed countries: UN classificationLebanonLesothoLiberiaLibyaLithuaniaLow & middle incomeLow incomeLower middle incomeLuxembourgMacao SAR, ChinaMacedonia, FYRMadagascarMalawiMalaysiaMaldivesMaliMaltaMarshall IslandsMauritaniaMauritiusMexicoMicronesia, Fed. Sts.Middle East & North AfricaMiddle East & North Africa (excluding high income)Middle East & North Africa (IDA & IBRD countries)Middle incomeMoldovaMongoliaMontenegroMoroccoMozambiqueMyanmarNamibiaNepalNetherlandsNew CaledoniaNew ZealandNicaraguaNigerNigeriaNorth AmericaNorwayOECD membersOmanOther small statesPacific island small statesPakistanPalauPanamaPapua New GuineaParaguayPeruPhilippinesPolandPortugalPost-demographic dividendPre-demographic dividendQatarRomaniaRussian FederationRwandaSamoaSao Tome and PrincipeSaudi ArabiaSenegalSerbiaSeychellesSierra LeoneSingaporeSint Maarten (Dutch part)Slovak RepublicSloveniaSmall statesSolomon IslandsSouth AfricaSouth AsiaSouth Asia (IDA & IBRD)South SudanSpainSri LankaSt. Kitts and NevisSt. LuciaSt. Vincent and the GrenadinesSub-Saharan Africa Sub-Saharan Africa (excluding high income)Sub-Saharan Africa (IDA & IBRD countries)SudanSurinameSwazilandSwedenSwitzerlandSyrian Arab RepublicTajikistanTanzaniaThailandTimor-LesteTogoTongaTrinidad and TobagoTunisiaTurkeyTuvaluUgandaUkraineUnited KingdomUnited StatesUpper middle incomeUruguayVanuatuVenezuela, RBVietnamWest Bank and GazaWorldYemen, Rep.ZambiaZimbabwe Timeline:
This timeline shows a graph from 1982 to 2016 of Indonesia. No data until 1981. Number of actual observations by date: 35.
Source name:
World Development Indicators
Source organization:
International Monetary Fund, Balance of Payments Statistics Yearbook and data files.
Categories, topics:
Economy & Growth
Last updated:
apr 23, 2017
Indicators value changes by year
Minimum:
88.0 mln
jan 1, 1986
Maximum:
10.362 bln
jan 1, 2016
At the date of observation
Value
Absolute change
Change from previous value
jan 1, 1982
250.0 mln
+250.0 mln
0.0%
jan 1, 1983
134.0 mln
-116.0 mln
-46.4%
jan 1, 1984
114.0 mln
-20.0 mln
-14.93%
jan 1, 1985
167.0 mln
+53.0 mln
46.49%
jan 1, 1986
88.0 mln
-79.0 mln
-47.31%
jan 1, 1987
259.0 mln
+171.0 mln
194.32%
jan 1, 1988
257.0 mln
-2.0 mln
-0.77%
jan 1, 1989
254.0 mln
-3.0 mln
-1.17%
jan 1, 1990
339.0 mln
+85.0 mln
33.46%
jan 1, 1991
418.0 mln
+79.0 mln
23.3%
jan 1, 1992
262.0 mln
-156.0 mln
-37.32%
jan 1, 1993
571.0 mln
+309.0 mln
117.94%
jan 1, 1994
537.0 mln
-34.0 mln
-5.95%
jan 1, 1995
619.0 mln
+82.0 mln
15.27%
jan 1, 1996
981.0 mln
+362.0 mln
58.48%
jan 1, 1997
937.0 mln
-44.0 mln
-4.49%
jan 1, 1998
1.034 bln
+97.0 mln
10.35%
jan 1, 1999
1.466 bln
+432.351 mln
41.81%
jan 1, 2000
1.914 bln
+447.249 mln
30.5%
jan 1, 2001
1.816 bln
-97.2 mln
-5.08%
jan 1, 2002
1.52 bln
-296.4 mln
-16.32%
jan 1, 2003
2.21 bln
+690.448 mln
45.42%
jan 1, 2004
2.053 bln
-157.758 mln
-7.14%
jan 1, 2005
2.433 bln
+380.081 mln
18.52%
jan 1, 2006
5.993 bln
+3.56 bln
146.33%
jan 1, 2007
6.079 bln
+86.263 mln
1.44%
jan 1, 2008
6.801 bln
+721.702 mln
11.87%
jan 1, 2009
7.352 bln
+551.66 mln
8.11%
jan 1, 2010
7.241 bln
-111.455 mln
-1.52%
jan 1, 2011
7.571 bln
+330.545 mln
4.57%
jan 1, 2012
7.636 bln
+64.376 mln
0.85%
jan 1, 2013
8.067 bln
+431.121 mln
5.65%
jan 1, 2014
8.508 bln
+441.548 mln
5.47%
jan 1, 2015
9.374 bln
+865.248 mln
10.17%
jan 1, 2016
10.362 bln
+988.037 mln
10.54%
Ranking of countries by current statistics by years


Comments: