29
/
en
AIzaSyAYiBZKx7MnpbEhh9jyipgxe19OcubqV5w
April 1, 2024
26901
Early-demographic dividend
EAR
false
2
1
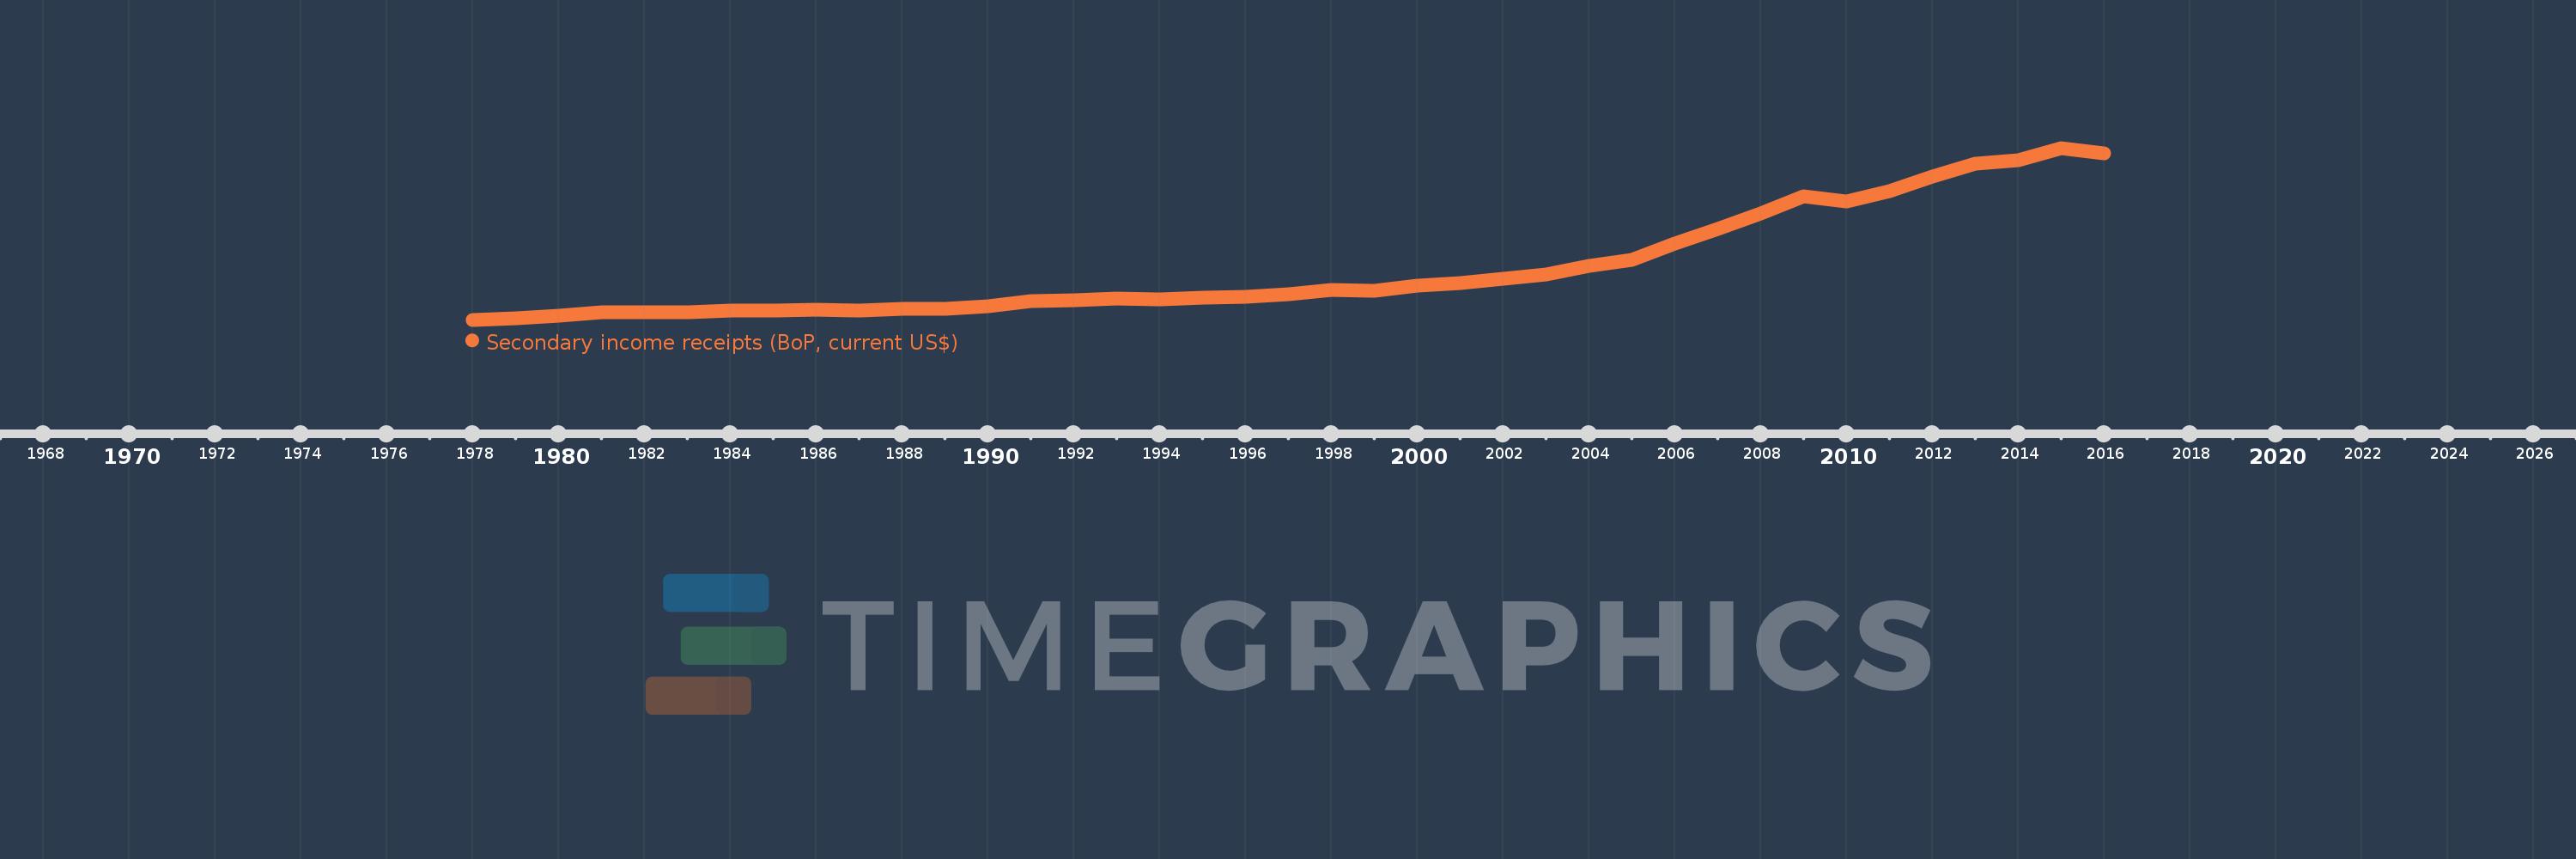
Secondary income receipts (BoP, current US$)
2016,2015,2014,2013,2012,2011,2010,2009,2008,2007,2006,2005,2004,2003,2002,2001,2000,1999,1998,1997,1996,1995,1994,1993,1992,1991,1990,1989,1988,1987,1986,1985,1984,1983,1982,1981,1980,1979,1978
This statistics in other country:
AfghanistanAlbaniaAlgeriaAngolaAntigua and BarbudaArab WorldArgentinaArmeniaArubaAustraliaAustriaAzerbaijanBahamas, TheBahrainBangladeshBarbadosBelarusBelgiumBelizeBeninBermudaBhutanBoliviaBosnia and HerzegovinaBotswanaBrazilBrunei DarussalamBulgariaBurkina FasoBurundiCabo VerdeCambodiaCameroonCanadaCaribbean small statesCentral African RepublicCentral Europe and the BalticsChadChileChinaColombiaComorosCongo, Dem. Rep.Congo, Rep.Costa RicaCote d'IvoireCroatiaCuracaoCyprusCzech RepublicDenmarkDjiboutiDominicaDominican RepublicEarly-demographic dividendEast Asia & PacificEast Asia & Pacific (excluding high income)East Asia & Pacific (IDA & IBRD countries)EcuadorEgypt, Arab Rep.El SalvadorEquatorial GuineaEritreaEstoniaEthiopiaEuro areaEurope & Central AsiaEurope & Central Asia (excluding high income)Europe & Central Asia (IDA & IBRD countries)European UnionFaroe IslandsFijiFinlandFragile and conflict affected situationsFranceFrench PolynesiaGabonGambia, TheGeorgiaGermanyGhanaGreeceGrenadaGuatemalaGuineaGuinea-BissauGuyanaHaitiHeavily indebted poor countries (HIPC)High incomeHondurasHong Kong SAR, ChinaHungaryIBRD onlyIcelandIDA & IBRD totalIDA blendIDA onlyIDA totalIndiaIndonesiaIran, Islamic Rep.IraqIrelandIsraelItalyJamaicaJapanJordanKazakhstanKenyaKiribatiKorea, Rep.KosovoKuwaitKyrgyz RepublicLao PDRLate-demographic dividendLatin America & Caribbean Latin America & Caribbean (excluding high income)Latin America & the Caribbean (IDA & IBRD countries)LatviaLeast developed countries: UN classificationLebanonLesothoLiberiaLibyaLithuaniaLow & middle incomeLow incomeLower middle incomeLuxembourgMacao SAR, ChinaMacedonia, FYRMadagascarMalawiMalaysiaMaldivesMaliMaltaMarshall IslandsMauritaniaMauritiusMexicoMicronesia, Fed. Sts.Middle East & North AfricaMiddle East & North Africa (excluding high income)Middle East & North Africa (IDA & IBRD countries)Middle incomeMoldovaMongoliaMontenegroMoroccoMozambiqueMyanmarNamibiaNepalNetherlandsNew CaledoniaNew ZealandNicaraguaNigerNigeriaNorth AmericaNorwayOECD membersOmanOther small statesPacific island small statesPakistanPalauPanamaPapua New GuineaParaguayPeruPhilippinesPolandPortugalPost-demographic dividendPre-demographic dividendQatarRomaniaRussian FederationRwandaSamoaSao Tome and PrincipeSaudi ArabiaSenegalSerbiaSeychellesSierra LeoneSingaporeSint Maarten (Dutch part)Slovak RepublicSloveniaSmall statesSolomon IslandsSouth AfricaSouth AsiaSouth Asia (IDA & IBRD)South SudanSpainSri LankaSt. Kitts and NevisSt. LuciaSt. Vincent and the GrenadinesSub-Saharan Africa Sub-Saharan Africa (excluding high income)Sub-Saharan Africa (IDA & IBRD countries)SudanSurinameSwazilandSwedenSwitzerlandSyrian Arab RepublicTajikistanTanzaniaThailandTimor-LesteTogoTongaTrinidad and TobagoTunisiaTurkeyTuvaluUgandaUkraineUnited KingdomUnited StatesUpper middle incomeUruguayVanuatuVenezuela, RBVietnamWest Bank and GazaWorldYemen, Rep.ZambiaZimbabwe Timeline:
This timeline shows a graph from 1978 to 2016 of Early-demographic dividend. No data until 1977. Number of actual observations by date: 39.
Source name:
World Development Indicators
Source organization:
International Monetary Fund, Balance of Payments Statistics Yearbook and data files.
Categories, topics:
Economy & Growth
Last updated:
apr 23, 2017
Indicators value changes by year
Minimum:
11.931 bln
jan 1, 1978
Maximum:
289.308 bln
jan 1, 2015
At the date of observation
Value
Absolute change
Change from previous value
jan 1, 1978
11.931 bln
+11.931 bln
0.0%
jan 1, 1979
13.831 bln
+1.899 bln
15.92%
jan 1, 1980
18.783 bln
+4.953 bln
35.81%
jan 1, 1981
23.859 bln
+5.076 bln
27.02%
jan 1, 1982
24.331 bln
+471.585 mln
1.98%
jan 1, 1983
23.858 bln
-472.557 mln
-1.94%
jan 1, 1984
26.199 bln
+2.341 bln
9.81%
jan 1, 1985
27.257 bln
+1.058 bln
4.04%
jan 1, 1986
28.654 bln
+1.398 bln
5.13%
jan 1, 1987
27.459 bln
-1.195 bln
-4.17%
jan 1, 1988
29.882 bln
+2.422 bln
8.82%
jan 1, 1989
29.663 bln
-218.263 mln
-0.73%
jan 1, 1990
33.337 bln
+3.674 bln
12.39%
jan 1, 1991
41.724 bln
+8.387 bln
25.16%
jan 1, 1992
42.818 bln
+1.094 bln
2.62%
jan 1, 1993
45.527 bln
+2.709 bln
6.33%
jan 1, 1994
45.197 bln
-329.831 mln
-0.72%
jan 1, 1995
46.943 bln
+1.746 bln
3.86%
jan 1, 1996
49.05 bln
+2.106 bln
4.49%
jan 1, 1997
53.268 bln
+4.218 bln
8.6%
jan 1, 1998
60.14 bln
+6.872 bln
12.9%
jan 1, 1999
59.054 bln
-1.086 bln
-1.81%
jan 1, 2000
67.633 bln
+8.58 bln
14.53%
jan 1, 2001
71.679 bln
+4.045 bln
5.98%
jan 1, 2002
77.711 bln
+6.033 bln
8.42%
jan 1, 2003
85.278 bln
+7.567 bln
9.74%
jan 1, 2004
99.294 bln
+14.016 bln
16.44%
jan 1, 2005
108.289 bln
+8.996 bln
9.06%
jan 1, 2006
134.801 bln
+26.511 bln
24.48%
jan 1, 2007
158.632 bln
+23.831 bln
17.68%
jan 1, 2008
183.301 bln
+24.669 bln
15.55%
jan 1, 2009
211.051 bln
+27.75 bln
15.14%
jan 1, 2010
202.309 bln
-8.742 bln
-4.14%
jan 1, 2011
219.453 bln
+17.144 bln
8.47%
jan 1, 2012
242.947 bln
+23.493 bln
10.71%
jan 1, 2013
264.37 bln
+21.424 bln
8.82%
jan 1, 2014
269.202 bln
+4.832 bln
1.83%
jan 1, 2015
289.308 bln
+20.106 bln
7.47%
jan 1, 2016
279.985 bln
-9.322 bln
-3.22%
Ranking of countries by current statistics by years


Comments: