29
/
en
AIzaSyAYiBZKx7MnpbEhh9jyipgxe19OcubqV5w
April 1, 2024
149749
Haiti
HTI
true
2
1
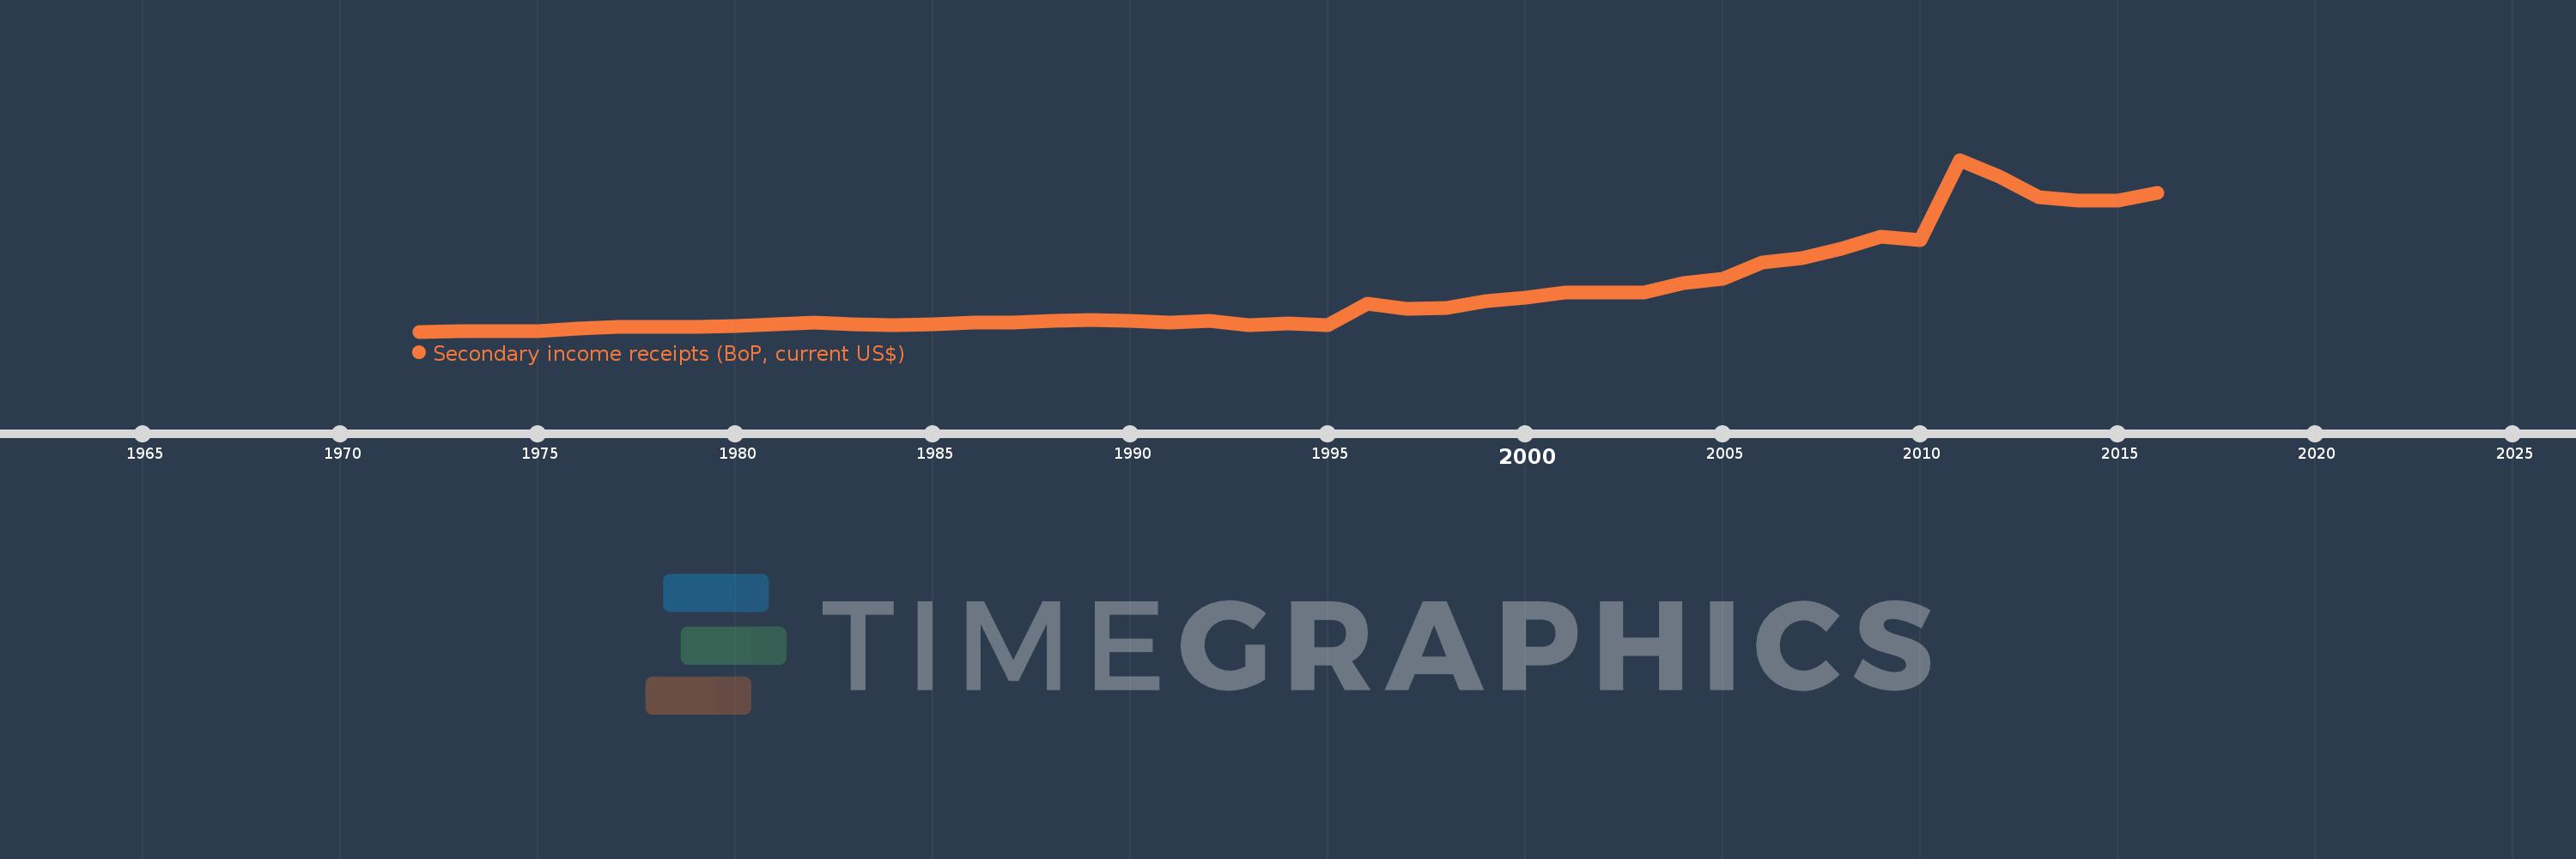
Secondary income receipts (BoP, current US$)
2016,2015,2014,2013,2012,2011,2010,2009,2008,2007,2006,2005,2004,2003,2002,2001,2000,1999,1998,1997,1996,1995,1994,1993,1992,1991,1990,1989,1988,1987,1986,1985,1984,1983,1982,1981,1980,1979,1978,1977,1976,1975,1974,1973,1972
This statistics in other country:
AfghanistanAlbaniaAlgeriaAngolaAntigua and BarbudaArab WorldArgentinaArmeniaArubaAustraliaAustriaAzerbaijanBahamas, TheBahrainBangladeshBarbadosBelarusBelgiumBelizeBeninBermudaBhutanBoliviaBosnia and HerzegovinaBotswanaBrazilBrunei DarussalamBulgariaBurkina FasoBurundiCabo VerdeCambodiaCameroonCanadaCaribbean small statesCentral African RepublicCentral Europe and the BalticsChadChileChinaColombiaComorosCongo, Dem. Rep.Congo, Rep.Costa RicaCote d'IvoireCroatiaCuracaoCyprusCzech RepublicDenmarkDjiboutiDominicaDominican RepublicEarly-demographic dividendEast Asia & PacificEast Asia & Pacific (excluding high income)East Asia & Pacific (IDA & IBRD countries)EcuadorEgypt, Arab Rep.El SalvadorEquatorial GuineaEritreaEstoniaEthiopiaEuro areaEurope & Central AsiaEurope & Central Asia (excluding high income)Europe & Central Asia (IDA & IBRD countries)European UnionFaroe IslandsFijiFinlandFragile and conflict affected situationsFranceFrench PolynesiaGabonGambia, TheGeorgiaGermanyGhanaGreeceGrenadaGuatemalaGuineaGuinea-BissauGuyanaHaitiHeavily indebted poor countries (HIPC)High incomeHondurasHong Kong SAR, ChinaHungaryIBRD onlyIcelandIDA & IBRD totalIDA blendIDA onlyIDA totalIndiaIndonesiaIran, Islamic Rep.IraqIrelandIsraelItalyJamaicaJapanJordanKazakhstanKenyaKiribatiKorea, Rep.KosovoKuwaitKyrgyz RepublicLao PDRLate-demographic dividendLatin America & Caribbean Latin America & Caribbean (excluding high income)Latin America & the Caribbean (IDA & IBRD countries)LatviaLeast developed countries: UN classificationLebanonLesothoLiberiaLibyaLithuaniaLow & middle incomeLow incomeLower middle incomeLuxembourgMacao SAR, ChinaMacedonia, FYRMadagascarMalawiMalaysiaMaldivesMaliMaltaMarshall IslandsMauritaniaMauritiusMexicoMicronesia, Fed. Sts.Middle East & North AfricaMiddle East & North Africa (excluding high income)Middle East & North Africa (IDA & IBRD countries)Middle incomeMoldovaMongoliaMontenegroMoroccoMozambiqueMyanmarNamibiaNepalNetherlandsNew CaledoniaNew ZealandNicaraguaNigerNigeriaNorth AmericaNorwayOECD membersOmanOther small statesPacific island small statesPakistanPalauPanamaPapua New GuineaParaguayPeruPhilippinesPolandPortugalPost-demographic dividendPre-demographic dividendQatarRomaniaRussian FederationRwandaSamoaSao Tome and PrincipeSaudi ArabiaSenegalSerbiaSeychellesSierra LeoneSingaporeSint Maarten (Dutch part)Slovak RepublicSloveniaSmall statesSolomon IslandsSouth AfricaSouth AsiaSouth Asia (IDA & IBRD)South SudanSpainSri LankaSt. Kitts and NevisSt. LuciaSt. Vincent and the GrenadinesSub-Saharan Africa Sub-Saharan Africa (excluding high income)Sub-Saharan Africa (IDA & IBRD countries)SudanSurinameSwazilandSwedenSwitzerlandSyrian Arab RepublicTajikistanTanzaniaThailandTimor-LesteTogoTongaTrinidad and TobagoTunisiaTurkeyTuvaluUgandaUkraineUnited KingdomUnited StatesUpper middle incomeUruguayVanuatuVenezuela, RBVietnamWest Bank and GazaWorldYemen, Rep.ZambiaZimbabwe Timeline:
This timeline shows a graph from 1972 to 2016 of Haiti. No data until 1971. Number of actual observations by date: 45.
Source name:
World Development Indicators
Source organization:
International Monetary Fund, Balance of Payments Statistics Yearbook and data files.
Categories, topics:
Economy & Growth
Last updated:
apr 23, 2017
Indicators value changes by year
Minimum:
25.1 mln
jan 1, 1972
Maximum:
3.314 bln
jan 1, 2011
At the date of observation
Value
Absolute change
Change from previous value
jan 1, 1972
25.1 mln
+25.1 mln
0.0%
jan 1, 1973
32.68 mln
+7.58 mln
30.2%
jan 1, 1974
33.34 mln
+660.12K
2.02%
jan 1, 1975
36.5 mln
+3.16 mln
9.48%
jan 1, 1976
76.92 mln
+40.42 mln
110.74%
jan 1, 1977
111.94 mln
+35.02 mln
45.53%
jan 1, 1978
107.6 mln
-4.34 mln
-3.88%
jan 1, 1979
115.18 mln
+7.58 mln
7.04%
jan 1, 1980
126.54 mln
+11.36 mln
9.86%
jan 1, 1981
158.72 mln
+32.18 mln
25.43%
jan 1, 1982
201.18 mln
+42.46 mln
26.75%
jan 1, 1983
159.04 mln
-42.14 mln
-20.95%
jan 1, 1984
153.88 mln
-5.16 mln
-3.24%
jan 1, 1985
168.0 mln
+14.12 mln
9.18%
jan 1, 1986
192.28 mln
+24.28 mln
14.45%
jan 1, 1987
205.26 mln
+12.98 mln
6.75%
jan 1, 1988
227.98 mln
+22.72 mln
11.07%
jan 1, 1989
253.56 mln
+25.58 mln
11.22%
jan 1, 1990
237.74 mln
-15.82 mln
-6.24%
jan 1, 1991
192.9 mln
-44.84 mln
-18.86%
jan 1, 1992
234.2 mln
+41.3 mln
21.41%
jan 1, 1993
155.0 mln
-79.2 mln
-33.82%
jan 1, 1994
173.4 mln
+18.4 mln
11.87%
jan 1, 1995
156.2 mln
-17.2 mln
-9.92%
jan 1, 1996
552.87 mln
+396.67 mln
253.95%
jan 1, 1997
462.52 mln
-90.35 mln
-16.34%
jan 1, 1998
477.9 mln
+15.38 mln
3.33%
jan 1, 1999
606.5 mln
+128.6 mln
26.91%
jan 1, 2000
673.65 mln
+67.15 mln
11.07%
jan 1, 2001
771.0 mln
+97.35 mln
14.45%
jan 1, 2002
768.58 mln
-2.42 mln
-0.31%
jan 1, 2003
775.66 mln
+7.08 mln
0.92%
jan 1, 2004
948.0 mln
+172.34 mln
22.22%
jan 1, 2005
1.037 bln
+89.43 mln
9.43%
jan 1, 2006
1.35 bln
+312.144 mln
30.09%
jan 1, 2007
1.436 bln
+86.745 mln
6.43%
jan 1, 2008
1.614 bln
+177.37 mln
12.35%
jan 1, 2009
1.843 bln
+229.608 mln
14.23%
jan 1, 2010
1.77 bln
-73.247 mln
-3.97%
jan 1, 2011
3.314 bln
+1.544 bln
87.22%
jan 1, 2012
2.997 bln
-316.438 mln
-9.55%
jan 1, 2013
2.6 bln
-397.53 mln
-13.26%
jan 1, 2014
2.531 bln
-68.844 mln
-2.65%
jan 1, 2015
2.54 bln
+9.042 mln
0.36%
jan 1, 2016
2.685 bln
+144.466 mln
5.69%
Ranking of countries by current statistics by years


Comments: