29
/
en
AIzaSyAYiBZKx7MnpbEhh9jyipgxe19OcubqV5w
April 1, 2024
163262
Jamaica
JAM
true
2
1
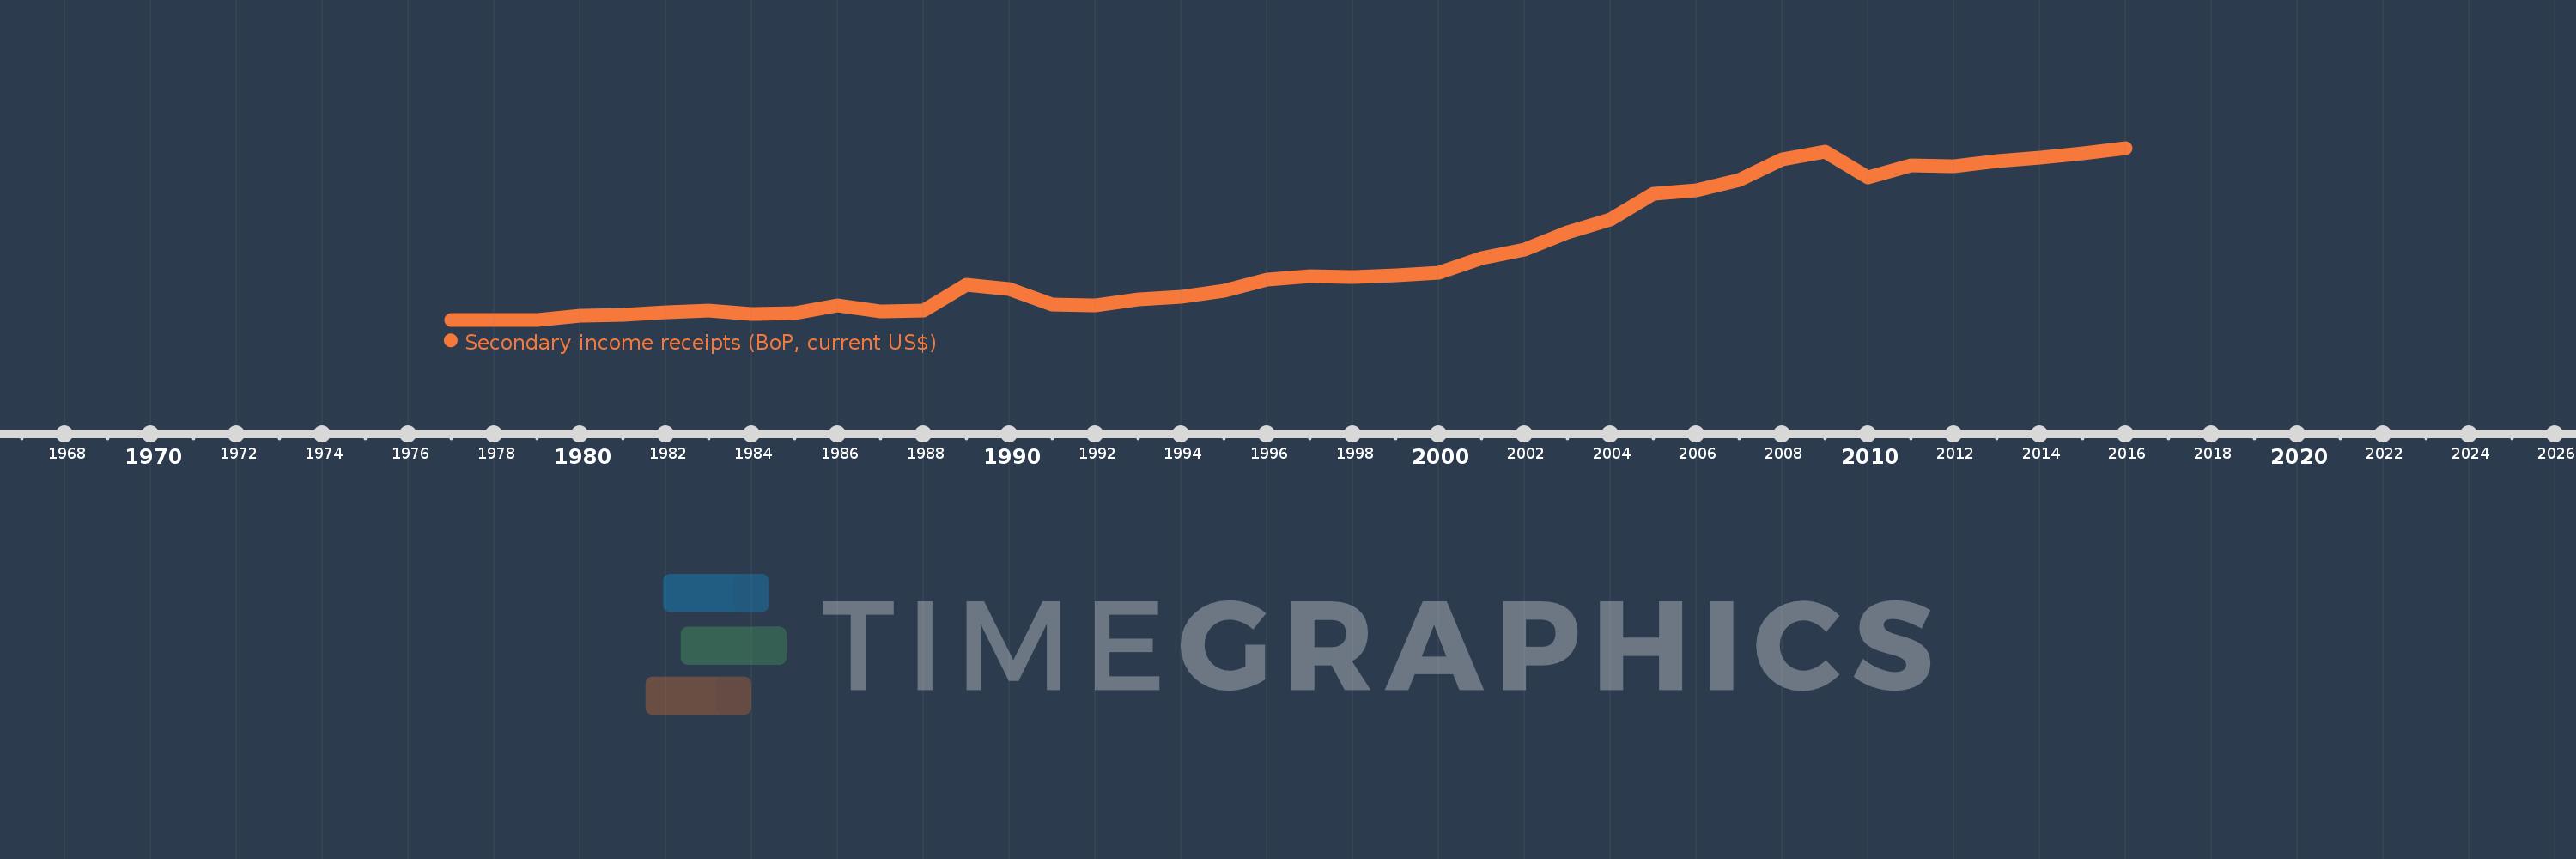
Secondary income receipts (BoP, current US$)
2016,2015,2014,2013,2012,2011,2010,2009,2008,2007,2006,2005,2004,2003,2002,2001,2000,1999,1998,1997,1996,1995,1994,1993,1992,1991,1990,1989,1988,1987,1986,1985,1984,1983,1982,1981,1980,1979,1978,1977
This statistics in other country:
AfghanistanAlbaniaAlgeriaAngolaAntigua and BarbudaArab WorldArgentinaArmeniaArubaAustraliaAustriaAzerbaijanBahamas, TheBahrainBangladeshBarbadosBelarusBelgiumBelizeBeninBermudaBhutanBoliviaBosnia and HerzegovinaBotswanaBrazilBrunei DarussalamBulgariaBurkina FasoBurundiCabo VerdeCambodiaCameroonCanadaCaribbean small statesCentral African RepublicCentral Europe and the BalticsChadChileChinaColombiaComorosCongo, Dem. Rep.Congo, Rep.Costa RicaCote d'IvoireCroatiaCuracaoCyprusCzech RepublicDenmarkDjiboutiDominicaDominican RepublicEarly-demographic dividendEast Asia & PacificEast Asia & Pacific (excluding high income)East Asia & Pacific (IDA & IBRD countries)EcuadorEgypt, Arab Rep.El SalvadorEquatorial GuineaEritreaEstoniaEthiopiaEuro areaEurope & Central AsiaEurope & Central Asia (excluding high income)Europe & Central Asia (IDA & IBRD countries)European UnionFaroe IslandsFijiFinlandFragile and conflict affected situationsFranceFrench PolynesiaGabonGambia, TheGeorgiaGermanyGhanaGreeceGrenadaGuatemalaGuineaGuinea-BissauGuyanaHaitiHeavily indebted poor countries (HIPC)High incomeHondurasHong Kong SAR, ChinaHungaryIBRD onlyIcelandIDA & IBRD totalIDA blendIDA onlyIDA totalIndiaIndonesiaIran, Islamic Rep.IraqIrelandIsraelItalyJamaicaJapanJordanKazakhstanKenyaKiribatiKorea, Rep.KosovoKuwaitKyrgyz RepublicLao PDRLate-demographic dividendLatin America & Caribbean Latin America & Caribbean (excluding high income)Latin America & the Caribbean (IDA & IBRD countries)LatviaLeast developed countries: UN classificationLebanonLesothoLiberiaLibyaLithuaniaLow & middle incomeLow incomeLower middle incomeLuxembourgMacao SAR, ChinaMacedonia, FYRMadagascarMalawiMalaysiaMaldivesMaliMaltaMarshall IslandsMauritaniaMauritiusMexicoMicronesia, Fed. Sts.Middle East & North AfricaMiddle East & North Africa (excluding high income)Middle East & North Africa (IDA & IBRD countries)Middle incomeMoldovaMongoliaMontenegroMoroccoMozambiqueMyanmarNamibiaNepalNetherlandsNew CaledoniaNew ZealandNicaraguaNigerNigeriaNorth AmericaNorwayOECD membersOmanOther small statesPacific island small statesPakistanPalauPanamaPapua New GuineaParaguayPeruPhilippinesPolandPortugalPost-demographic dividendPre-demographic dividendQatarRomaniaRussian FederationRwandaSamoaSao Tome and PrincipeSaudi ArabiaSenegalSerbiaSeychellesSierra LeoneSingaporeSint Maarten (Dutch part)Slovak RepublicSloveniaSmall statesSolomon IslandsSouth AfricaSouth AsiaSouth Asia (IDA & IBRD)South SudanSpainSri LankaSt. Kitts and NevisSt. LuciaSt. Vincent and the GrenadinesSub-Saharan Africa Sub-Saharan Africa (excluding high income)Sub-Saharan Africa (IDA & IBRD countries)SudanSurinameSwazilandSwedenSwitzerlandSyrian Arab RepublicTajikistanTanzaniaThailandTimor-LesteTogoTongaTrinidad and TobagoTunisiaTurkeyTuvaluUgandaUkraineUnited KingdomUnited StatesUpper middle incomeUruguayVanuatuVenezuela, RBVietnamWest Bank and GazaWorldYemen, Rep.ZambiaZimbabwe Timeline:
This timeline shows a graph from 1977 to 2016 of Jamaica. No data until 1976. Number of actual observations by date: 40.
Source name:
World Development Indicators
Source organization:
International Monetary Fund, Balance of Payments Statistics Yearbook and data files.
Categories, topics:
Economy & Growth
Last updated:
apr 23, 2017
Indicators value changes by year
Minimum:
92.3 mln
jan 1, 1978
Maximum:
2.543 bln
jan 1, 2016
At the date of observation
Value
Absolute change
Change from previous value
jan 1, 1977
94.2 mln
+94.2 mln
0.0%
jan 1, 1978
92.3 mln
-1.9 mln
-2.02%
jan 1, 1979
93.3 mln
+1000.0K
1.08%
jan 1, 1980
152.7 mln
+59.4 mln
63.67%
jan 1, 1981
162.7 mln
+10.0 mln
6.55%
jan 1, 1982
199.3 mln
+36.6 mln
22.5%
jan 1, 1983
224.077 mln
+24.777 mln
12.43%
jan 1, 1984
178.298 mln
-45.779 mln
-20.43%
jan 1, 1985
181.629 mln
+3.33 mln
1.87%
jan 1, 1986
297.154 mln
+115.525 mln
63.61%
jan 1, 1987
211.222 mln
-85.932 mln
-28.92%
jan 1, 1988
218.568 mln
+7.346 mln
3.48%
jan 1, 1989
588.694 mln
+370.126 mln
169.34%
jan 1, 1990
523.986 mln
-64.708 mln
-10.99%
jan 1, 1991
314.901 mln
-209.084 mln
-39.9%
jan 1, 1992
294.8 mln
-20.101 mln
-6.38%
jan 1, 1993
387.2 mln
+92.4 mln
31.34%
jan 1, 1994
415.9 mln
+28.7 mln
7.41%
jan 1, 1995
504.2 mln
+88.3 mln
21.23%
jan 1, 1996
669.6 mln
+165.4 mln
32.8%
jan 1, 1997
709.3 mln
+39.7 mln
5.93%
jan 1, 1998
705.7 mln
-3.6 mln
-0.51%
jan 1, 1999
727.6 mln
+21.9 mln
3.1%
jan 1, 2000
757.9 mln
+30.3 mln
4.16%
jan 1, 2001
969.4 mln
+211.5 mln
27.91%
jan 1, 2002
1.091 bln
+121.3 mln
12.51%
jan 1, 2003
1.338 bln
+247.2 mln
22.66%
jan 1, 2004
1.524 bln
+185.6 mln
13.87%
jan 1, 2005
1.892 bln
+368.628 mln
24.2%
jan 1, 2006
1.935 bln
+43.324 mln
2.29%
jan 1, 2007
2.088 bln
+153.009 mln
7.91%
jan 1, 2008
2.386 bln
+297.198 mln
14.23%
jan 1, 2009
2.489 bln
+103.127 mln
4.32%
jan 1, 2010
2.122 bln
-366.745 mln
-14.74%
jan 1, 2011
2.293 bln
+170.861 mln
8.05%
jan 1, 2012
2.284 bln
-8.931 mln
-0.39%
jan 1, 2013
2.357 bln
+73.511 mln
3.22%
jan 1, 2014
2.401 bln
+43.574 mln
1.85%
jan 1, 2015
2.467 bln
+65.853 mln
2.74%
jan 1, 2016
2.543 bln
+76.097 mln
3.08%
Ranking of countries by current statistics by years


Comments: