29
/
en
AIzaSyAYiBZKx7MnpbEhh9jyipgxe19OcubqV5w
April 1, 2024
232788
Samoa
WSM
true
2
1
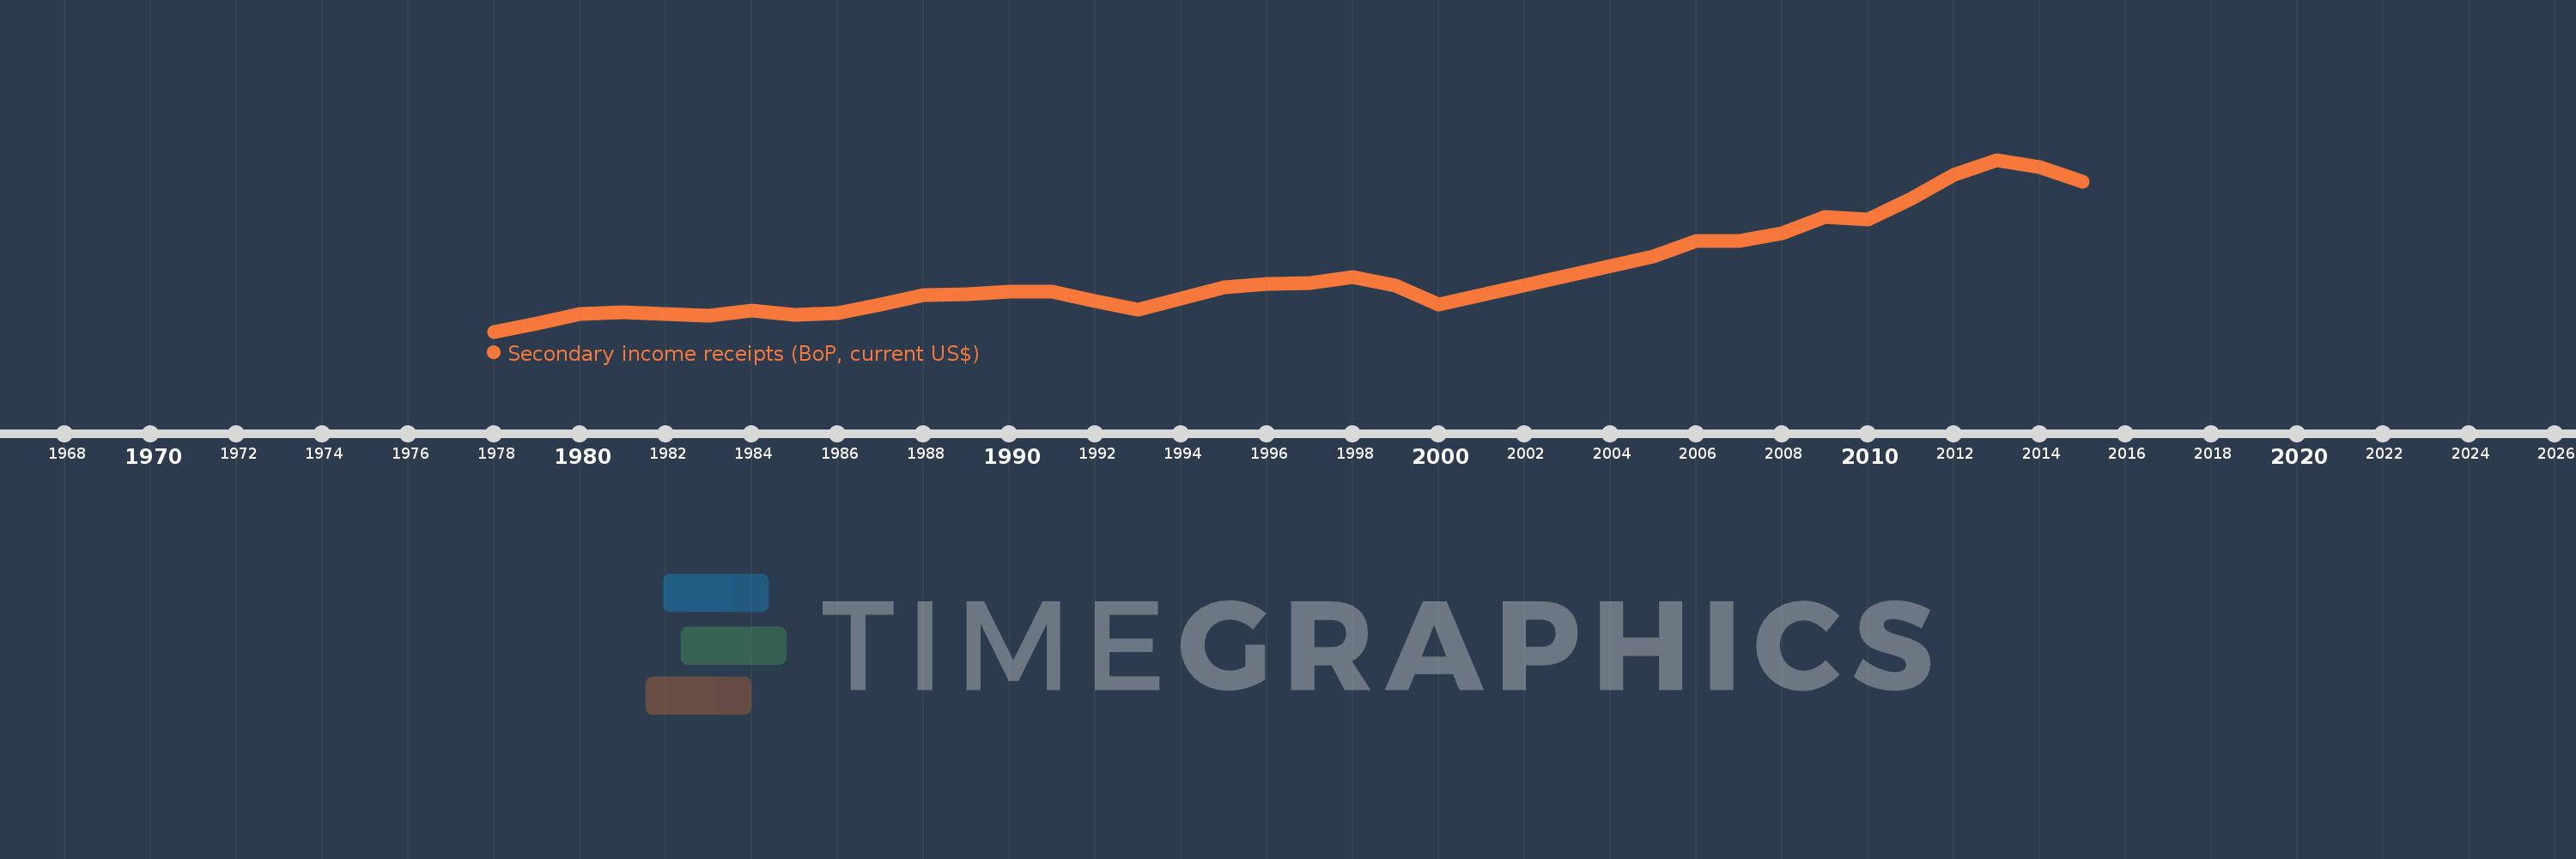
Secondary income receipts (BoP, current US$)
2015,2014,2013,2012,2011,2010,2009,2008,2007,2006,2005,2000,1999,1998,1997,1996,1995,1994,1993,1992,1991,1990,1989,1988,1987,1986,1985,1984,1983,1982,1981,1980,1979,1978
This statistics in other country:
AfghanistanAlbaniaAlgeriaAngolaAntigua and BarbudaArab WorldArgentinaArmeniaArubaAustraliaAustriaAzerbaijanBahamas, TheBahrainBangladeshBarbadosBelarusBelgiumBelizeBeninBermudaBhutanBoliviaBosnia and HerzegovinaBotswanaBrazilBrunei DarussalamBulgariaBurkina FasoBurundiCabo VerdeCambodiaCameroonCanadaCaribbean small statesCentral African RepublicCentral Europe and the BalticsChadChileChinaColombiaComorosCongo, Dem. Rep.Congo, Rep.Costa RicaCote d'IvoireCroatiaCuracaoCyprusCzech RepublicDenmarkDjiboutiDominicaDominican RepublicEarly-demographic dividendEast Asia & PacificEast Asia & Pacific (excluding high income)East Asia & Pacific (IDA & IBRD countries)EcuadorEgypt, Arab Rep.El SalvadorEquatorial GuineaEritreaEstoniaEthiopiaEuro areaEurope & Central AsiaEurope & Central Asia (excluding high income)Europe & Central Asia (IDA & IBRD countries)European UnionFaroe IslandsFijiFinlandFragile and conflict affected situationsFranceFrench PolynesiaGabonGambia, TheGeorgiaGermanyGhanaGreeceGrenadaGuatemalaGuineaGuinea-BissauGuyanaHaitiHeavily indebted poor countries (HIPC)High incomeHondurasHong Kong SAR, ChinaHungaryIBRD onlyIcelandIDA & IBRD totalIDA blendIDA onlyIDA totalIndiaIndonesiaIran, Islamic Rep.IraqIrelandIsraelItalyJamaicaJapanJordanKazakhstanKenyaKiribatiKorea, Rep.KosovoKuwaitKyrgyz RepublicLao PDRLate-demographic dividendLatin America & Caribbean Latin America & Caribbean (excluding high income)Latin America & the Caribbean (IDA & IBRD countries)LatviaLeast developed countries: UN classificationLebanonLesothoLiberiaLibyaLithuaniaLow & middle incomeLow incomeLower middle incomeLuxembourgMacao SAR, ChinaMacedonia, FYRMadagascarMalawiMalaysiaMaldivesMaliMaltaMarshall IslandsMauritaniaMauritiusMexicoMicronesia, Fed. Sts.Middle East & North AfricaMiddle East & North Africa (excluding high income)Middle East & North Africa (IDA & IBRD countries)Middle incomeMoldovaMongoliaMontenegroMoroccoMozambiqueMyanmarNamibiaNepalNetherlandsNew CaledoniaNew ZealandNicaraguaNigerNigeriaNorth AmericaNorwayOECD membersOmanOther small statesPacific island small statesPakistanPalauPanamaPapua New GuineaParaguayPeruPhilippinesPolandPortugalPost-demographic dividendPre-demographic dividendQatarRomaniaRussian FederationRwandaSamoaSao Tome and PrincipeSaudi ArabiaSenegalSerbiaSeychellesSierra LeoneSingaporeSint Maarten (Dutch part)Slovak RepublicSloveniaSmall statesSolomon IslandsSouth AfricaSouth AsiaSouth Asia (IDA & IBRD)South SudanSpainSri LankaSt. Kitts and NevisSt. LuciaSt. Vincent and the GrenadinesSub-Saharan Africa Sub-Saharan Africa (excluding high income)Sub-Saharan Africa (IDA & IBRD countries)SudanSurinameSwazilandSwedenSwitzerlandSyrian Arab RepublicTajikistanTanzaniaThailandTimor-LesteTogoTongaTrinidad and TobagoTunisiaTurkeyTuvaluUgandaUkraineUnited KingdomUnited StatesUpper middle incomeUruguayVanuatuVenezuela, RBVietnamWest Bank and GazaWorldYemen, Rep.ZambiaZimbabwe Timeline:
This timeline shows a graph from 1978 to 2015 of Samoa. No data until 1977. Number of actual observations by date: 34.
Source name:
World Development Indicators
Source organization:
International Monetary Fund, Balance of Payments Statistics Yearbook and data files.
Categories, topics:
Economy & Growth
Last updated:
apr 23, 2017
Indicators value changes by year
Minimum:
15.66 mln
jan 1, 1978
Maximum:
198.527 mln
jan 1, 2013
At the date of observation
Value
Absolute change
Change from previous value
jan 1, 1978
15.66 mln
+15.66 mln
0.0%
jan 1, 1979
24.16 mln
+8.5 mln
54.28%
jan 1, 1980
34.86 mln
+10.7 mln
44.29%
jan 1, 1981
36.169 mln
+1.308 mln
3.75%
jan 1, 1982
34.523 mln
-1.645 mln
-4.55%
jan 1, 1983
32.874 mln
-1.649 mln
-4.78%
jan 1, 1984
37.957 mln
+5.083 mln
15.46%
jan 1, 1985
33.856 mln
-4.101 mln
-10.8%
jan 1, 1986
35.63 mln
+1.775 mln
5.24%
jan 1, 1987
44.678 mln
+9.048 mln
25.39%
jan 1, 1988
54.262 mln
+9.584 mln
21.45%
jan 1, 1989
55.229 mln
+966.935K
1.78%
jan 1, 1990
58.361 mln
+3.132 mln
5.67%
jan 1, 1991
58.017 mln
-343.999K
-0.59%
jan 1, 1992
47.72 mln
-10.297 mln
-17.75%
jan 1, 1993
39.071 mln
-8.649 mln
-18.13%
jan 1, 1994
50.942 mln
+11.872 mln
30.38%
jan 1, 1995
62.749 mln
+11.807 mln
23.18%
jan 1, 1996
66.742 mln
+3.993 mln
6.36%
jan 1, 1997
66.888 mln
+146.048K
0.22%
jan 1, 1998
73.709 mln
+6.821 mln
10.2%
jan 1, 1999
64.121 mln
-9.588 mln
-13.01%
jan 1, 2000
44.671 mln
-19.451 mln
-30.33%
jan 1, 2005
95.843 mln
+51.173 mln
114.55%
jan 1, 2006
111.88 mln
+16.036 mln
16.73%
jan 1, 2007
112.061 mln
+181.483K
0.16%
jan 1, 2008
120.392 mln
+8.331 mln
7.43%
jan 1, 2009
138.048 mln
+17.655 mln
14.66%
jan 1, 2010
135.435 mln
-2.612 mln
-1.89%
jan 1, 2011
157.1 mln
+21.664 mln
16.0%
jan 1, 2012
182.13 mln
+25.03 mln
15.93%
jan 1, 2013
198.527 mln
+16.397 mln
9.0%
jan 1, 2014
190.413 mln
-8.114 mln
-4.09%
jan 1, 2015
175.204 mln
-15.208 mln
-7.99%
Ranking of countries by current statistics by years


Comments: