29
/
en
AIzaSyAYiBZKx7MnpbEhh9jyipgxe19OcubqV5w
April 1, 2024
187208
Malawi
MWI
true
2
1
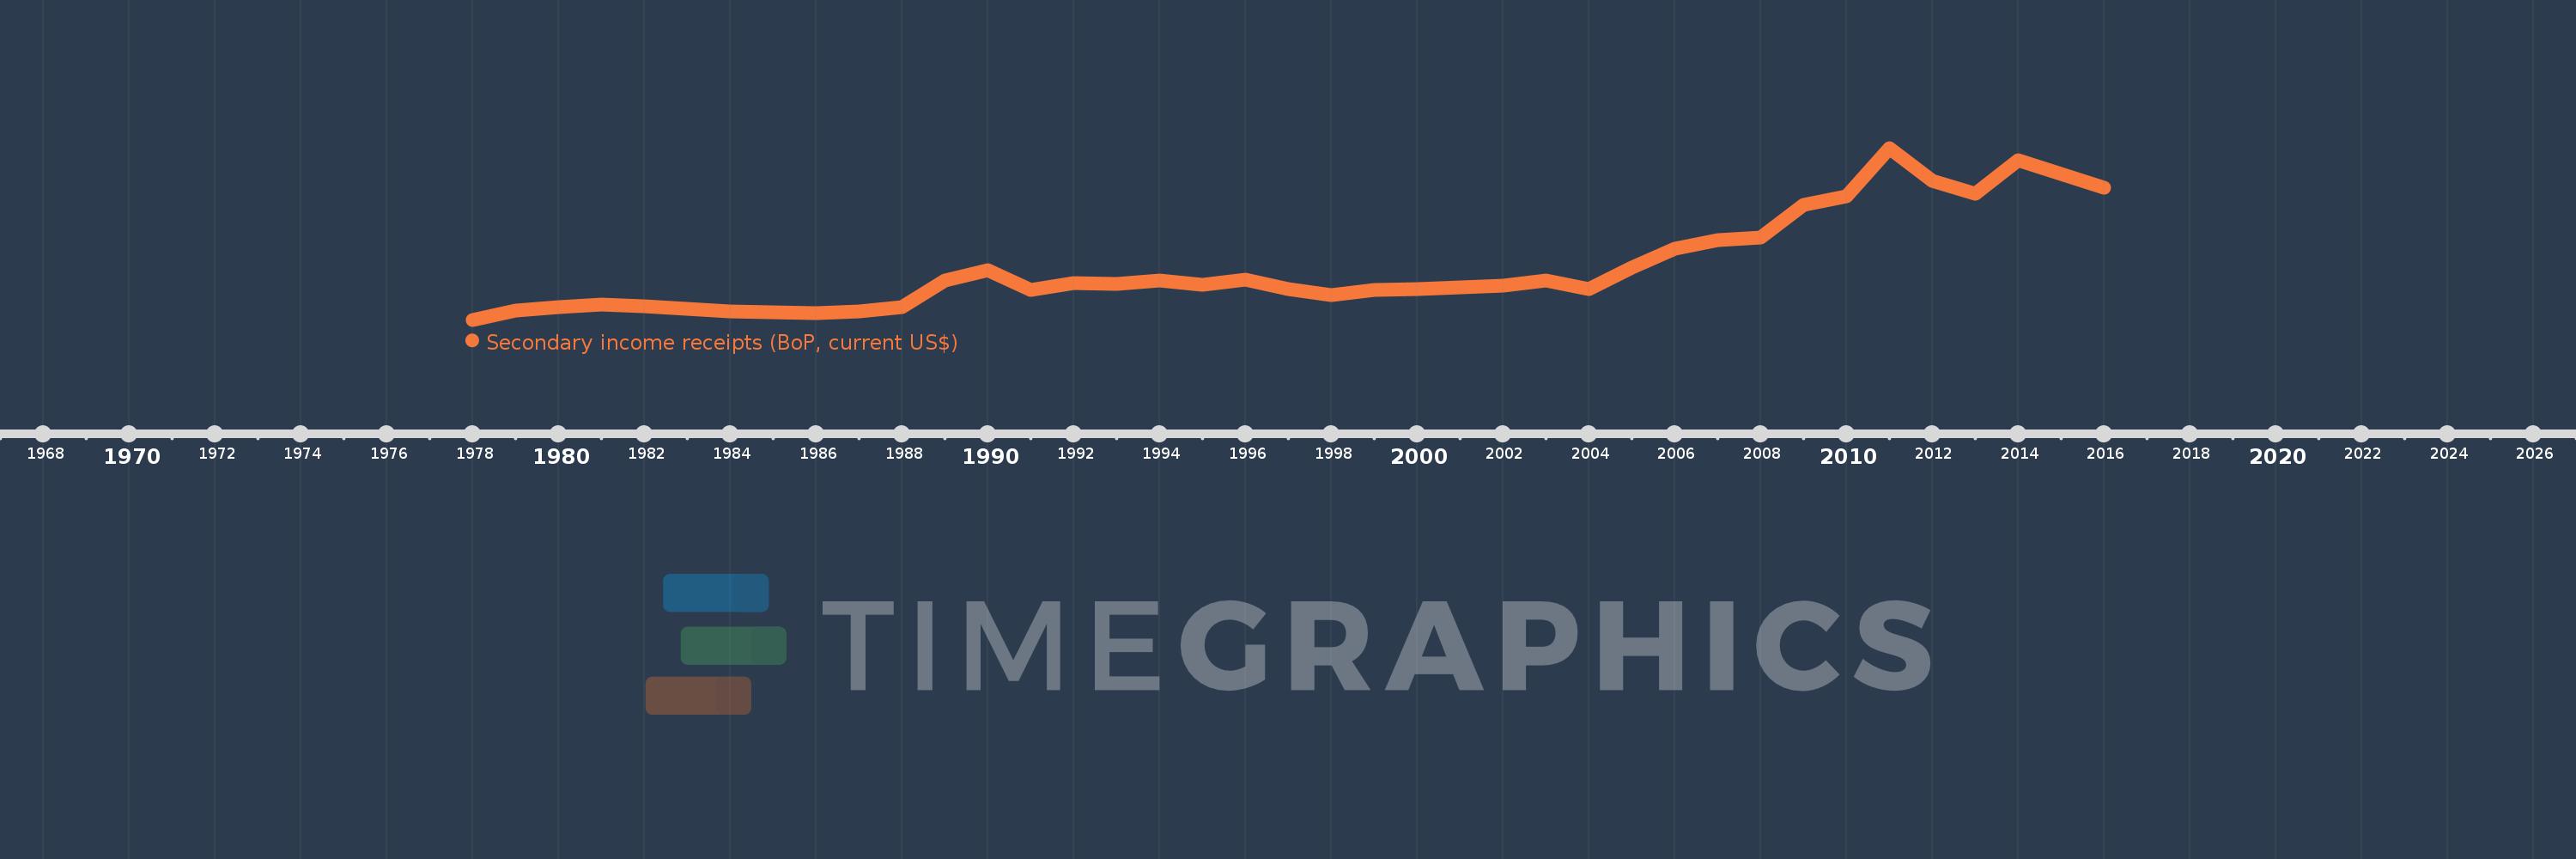
Secondary income receipts (BoP, current US$)
2016,2015,2014,2013,2012,2011,2010,2009,2008,2007,2006,2005,2004,2003,2002,2001,2000,1999,1998,1997,1996,1995,1994,1993,1992,1991,1990,1989,1988,1987,1986,1985,1984,1983,1982,1981,1980,1979,1978
This statistics in other country:
AfghanistanAlbaniaAlgeriaAngolaAntigua and BarbudaArab WorldArgentinaArmeniaArubaAustraliaAustriaAzerbaijanBahamas, TheBahrainBangladeshBarbadosBelarusBelgiumBelizeBeninBermudaBhutanBoliviaBosnia and HerzegovinaBotswanaBrazilBrunei DarussalamBulgariaBurkina FasoBurundiCabo VerdeCambodiaCameroonCanadaCaribbean small statesCentral African RepublicCentral Europe and the BalticsChadChileChinaColombiaComorosCongo, Dem. Rep.Congo, Rep.Costa RicaCote d'IvoireCroatiaCuracaoCyprusCzech RepublicDenmarkDjiboutiDominicaDominican RepublicEarly-demographic dividendEast Asia & PacificEast Asia & Pacific (excluding high income)East Asia & Pacific (IDA & IBRD countries)EcuadorEgypt, Arab Rep.El SalvadorEquatorial GuineaEritreaEstoniaEthiopiaEuro areaEurope & Central AsiaEurope & Central Asia (excluding high income)Europe & Central Asia (IDA & IBRD countries)European UnionFaroe IslandsFijiFinlandFragile and conflict affected situationsFranceFrench PolynesiaGabonGambia, TheGeorgiaGermanyGhanaGreeceGrenadaGuatemalaGuineaGuinea-BissauGuyanaHaitiHeavily indebted poor countries (HIPC)High incomeHondurasHong Kong SAR, ChinaHungaryIBRD onlyIcelandIDA & IBRD totalIDA blendIDA onlyIDA totalIndiaIndonesiaIran, Islamic Rep.IraqIrelandIsraelItalyJamaicaJapanJordanKazakhstanKenyaKiribatiKorea, Rep.KosovoKuwaitKyrgyz RepublicLao PDRLate-demographic dividendLatin America & Caribbean Latin America & Caribbean (excluding high income)Latin America & the Caribbean (IDA & IBRD countries)LatviaLeast developed countries: UN classificationLebanonLesothoLiberiaLibyaLithuaniaLow & middle incomeLow incomeLower middle incomeLuxembourgMacao SAR, ChinaMacedonia, FYRMadagascarMalawiMalaysiaMaldivesMaliMaltaMarshall IslandsMauritaniaMauritiusMexicoMicronesia, Fed. Sts.Middle East & North AfricaMiddle East & North Africa (excluding high income)Middle East & North Africa (IDA & IBRD countries)Middle incomeMoldovaMongoliaMontenegroMoroccoMozambiqueMyanmarNamibiaNepalNetherlandsNew CaledoniaNew ZealandNicaraguaNigerNigeriaNorth AmericaNorwayOECD membersOmanOther small statesPacific island small statesPakistanPalauPanamaPapua New GuineaParaguayPeruPhilippinesPolandPortugalPost-demographic dividendPre-demographic dividendQatarRomaniaRussian FederationRwandaSamoaSao Tome and PrincipeSaudi ArabiaSenegalSerbiaSeychellesSierra LeoneSingaporeSint Maarten (Dutch part)Slovak RepublicSloveniaSmall statesSolomon IslandsSouth AfricaSouth AsiaSouth Asia (IDA & IBRD)South SudanSpainSri LankaSt. Kitts and NevisSt. LuciaSt. Vincent and the GrenadinesSub-Saharan Africa Sub-Saharan Africa (excluding high income)Sub-Saharan Africa (IDA & IBRD countries)SudanSurinameSwazilandSwedenSwitzerlandSyrian Arab RepublicTajikistanTanzaniaThailandTimor-LesteTogoTongaTrinidad and TobagoTunisiaTurkeyTuvaluUgandaUkraineUnited KingdomUnited StatesUpper middle incomeUruguayVanuatuVenezuela, RBVietnamWest Bank and GazaWorldYemen, Rep.ZambiaZimbabwe Timeline:
This timeline shows a graph from 1978 to 2016 of Malawi. No data until 1977. Number of actual observations by date: 39.
Source name:
World Development Indicators
Source organization:
International Monetary Fund, Balance of Payments Statistics Yearbook and data files.
Categories, topics:
Economy & Growth
Last updated:
apr 23, 2017
Indicators value changes by year
Minimum:
26.026 mln
jan 1, 1978
Maximum:
651.671 mln
jan 1, 2011
At the date of observation
Value
Absolute change
Change from previous value
jan 1, 1978
26.026 mln
+26.026 mln
0.0%
jan 1, 1979
60.208 mln
+34.181 mln
131.33%
jan 1, 1980
71.369 mln
+11.162 mln
18.54%
jan 1, 1981
82.944 mln
+11.575 mln
16.22%
jan 1, 1982
75.922 mln
-7.022 mln
-8.47%
jan 1, 1983
65.658 mln
-10.265 mln
-13.52%
jan 1, 1984
55.502 mln
-10.156 mln
-15.47%
jan 1, 1985
54.406 mln
-1.096 mln
-1.97%
jan 1, 1986
48.581 mln
-5.825 mln
-10.71%
jan 1, 1987
57.698 mln
+9.117 mln
18.77%
jan 1, 1988
70.965 mln
+13.267 mln
22.99%
jan 1, 1989
169.378 mln
+98.413 mln
138.68%
jan 1, 1990
208.046 mln
+38.667 mln
22.83%
jan 1, 1991
134.121 mln
-73.925 mln
-35.53%
jan 1, 1992
159.026 mln
+24.905 mln
18.57%
jan 1, 1993
155.248 mln
-3.779 mln
-2.38%
jan 1, 1994
167.871 mln
+12.624 mln
8.13%
jan 1, 1995
154.022 mln
-13.849 mln
-8.25%
jan 1, 1996
171.045 mln
+17.022 mln
11.05%
jan 1, 1997
137.95 mln
-33.094 mln
-19.35%
jan 1, 1998
116.247 mln
-21.703 mln
-15.73%
jan 1, 1999
134.137 mln
+17.89 mln
15.39%
jan 1, 2000
137.665 mln
+3.528 mln
2.63%
jan 1, 2001
143.072 mln
+5.407 mln
3.93%
jan 1, 2002
148.759 mln
+5.687 mln
3.97%
jan 1, 2003
169.956 mln
+21.197 mln
14.25%
jan 1, 2004
138.934 mln
-31.021 mln
-18.25%
jan 1, 2005
214.493 mln
+75.558 mln
54.38%
jan 1, 2006
285.505 mln
+71.012 mln
33.11%
jan 1, 2007
315.056 mln
+29.551 mln
10.35%
jan 1, 2008
325.978 mln
+10.922 mln
3.47%
jan 1, 2009
443.229 mln
+117.251 mln
35.97%
jan 1, 2010
476.807 mln
+33.578 mln
7.58%
jan 1, 2011
651.671 mln
+174.864 mln
36.67%
jan 1, 2012
532.888 mln
-118.783 mln
-18.23%
jan 1, 2013
484.065 mln
-48.823 mln
-9.16%
jan 1, 2014
605.517 mln
+121.452 mln
25.09%
jan 1, 2015
557.76 mln
-47.758 mln
-7.89%
jan 1, 2016
507.711 mln
-50.049 mln
-8.97%
Ranking of countries by current statistics by years


Comments: