29
/
en
AIzaSyAYiBZKx7MnpbEhh9jyipgxe19OcubqV5w
April 1, 2024
78943
Bangladesh
BGD
true
2
1
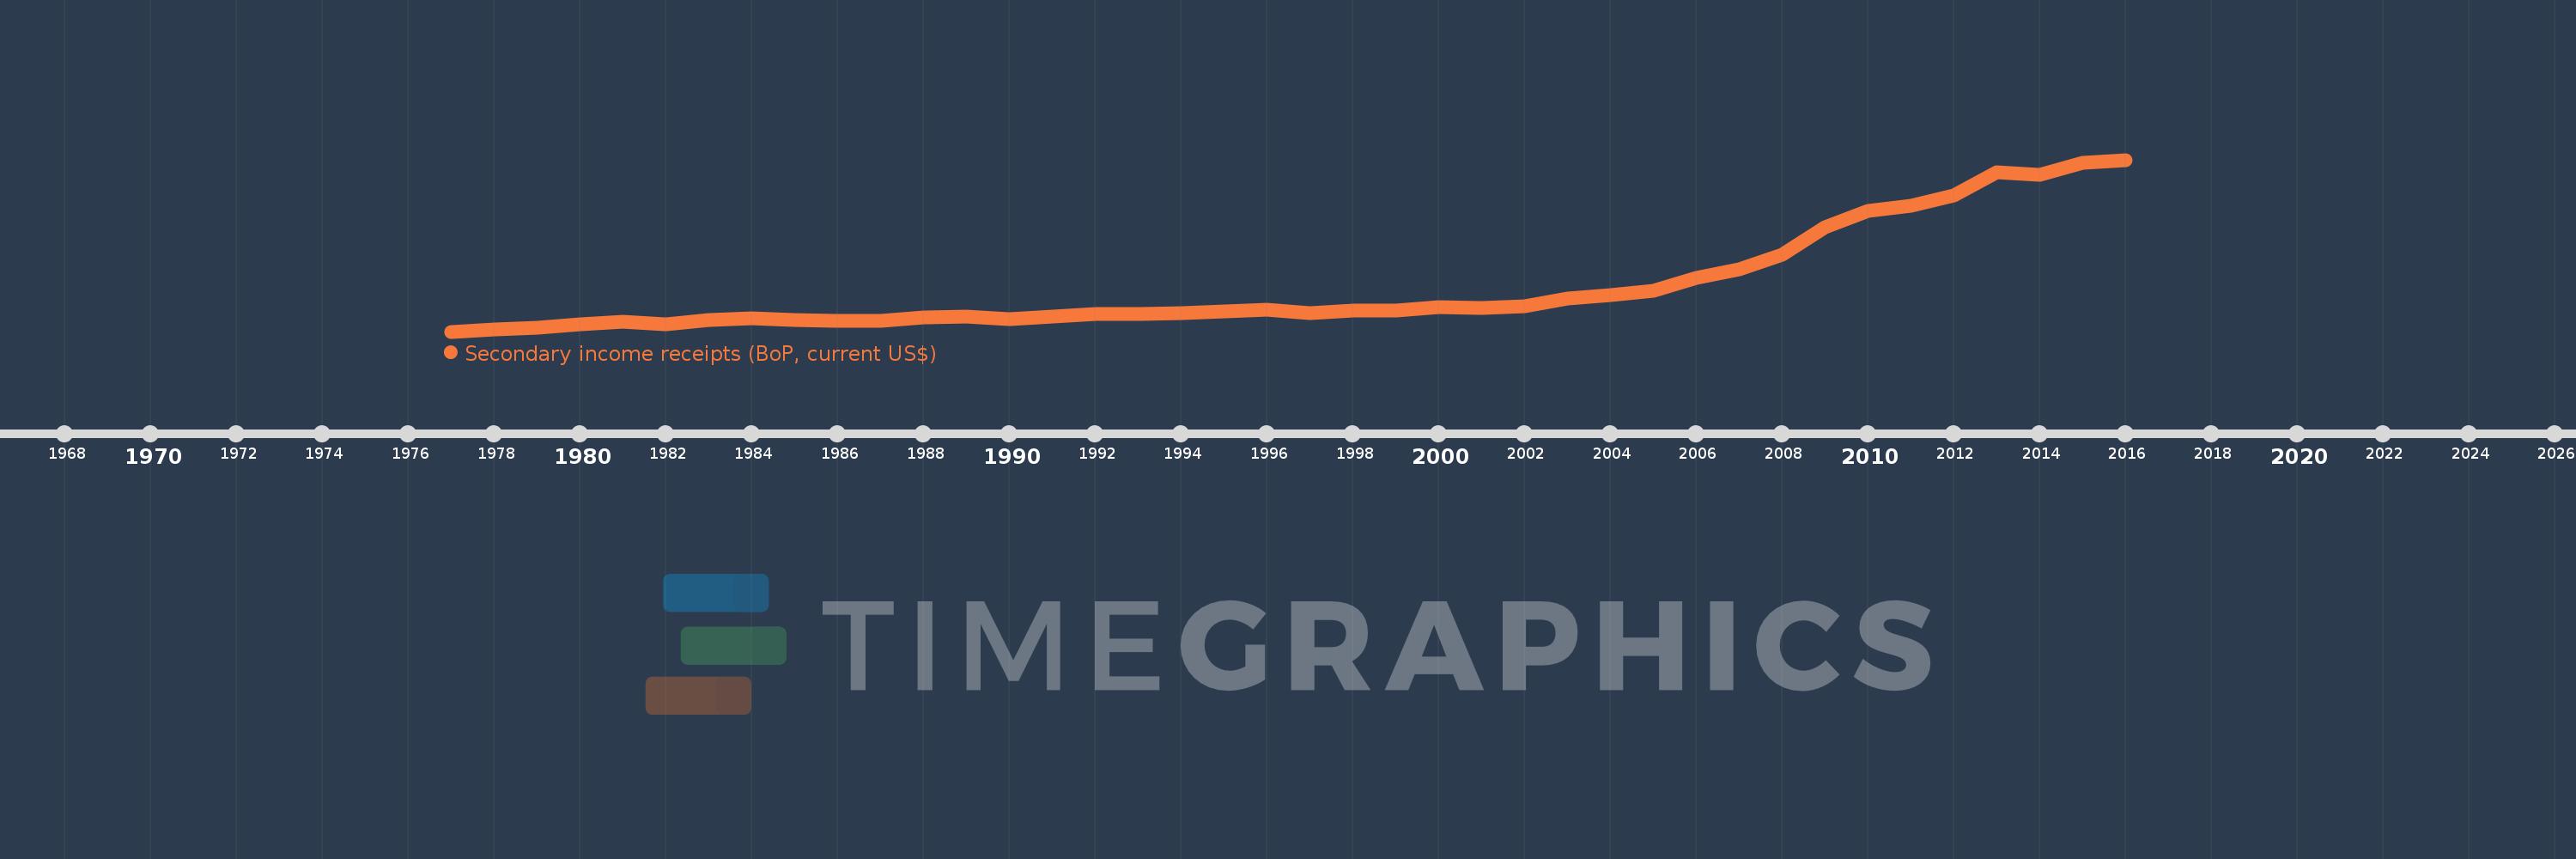
Secondary income receipts (BoP, current US$)
2016,2015,2014,2013,2012,2011,2010,2009,2008,2007,2006,2005,2004,2003,2002,2001,2000,1999,1998,1997,1996,1995,1994,1993,1992,1991,1990,1989,1988,1987,1986,1985,1984,1983,1982,1981,1980,1979,1978,1977
This statistics in other country:
AfghanistanAlbaniaAlgeriaAngolaAntigua and BarbudaArab WorldArgentinaArmeniaArubaAustraliaAustriaAzerbaijanBahamas, TheBahrainBangladeshBarbadosBelarusBelgiumBelizeBeninBermudaBhutanBoliviaBosnia and HerzegovinaBotswanaBrazilBrunei DarussalamBulgariaBurkina FasoBurundiCabo VerdeCambodiaCameroonCanadaCaribbean small statesCentral African RepublicCentral Europe and the BalticsChadChileChinaColombiaComorosCongo, Dem. Rep.Congo, Rep.Costa RicaCote d'IvoireCroatiaCuracaoCyprusCzech RepublicDenmarkDjiboutiDominicaDominican RepublicEarly-demographic dividendEast Asia & PacificEast Asia & Pacific (excluding high income)East Asia & Pacific (IDA & IBRD countries)EcuadorEgypt, Arab Rep.El SalvadorEquatorial GuineaEritreaEstoniaEthiopiaEuro areaEurope & Central AsiaEurope & Central Asia (excluding high income)Europe & Central Asia (IDA & IBRD countries)European UnionFaroe IslandsFijiFinlandFragile and conflict affected situationsFranceFrench PolynesiaGabonGambia, TheGeorgiaGermanyGhanaGreeceGrenadaGuatemalaGuineaGuinea-BissauGuyanaHaitiHeavily indebted poor countries (HIPC)High incomeHondurasHong Kong SAR, ChinaHungaryIBRD onlyIcelandIDA & IBRD totalIDA blendIDA onlyIDA totalIndiaIndonesiaIran, Islamic Rep.IraqIrelandIsraelItalyJamaicaJapanJordanKazakhstanKenyaKiribatiKorea, Rep.KosovoKuwaitKyrgyz RepublicLao PDRLate-demographic dividendLatin America & Caribbean Latin America & Caribbean (excluding high income)Latin America & the Caribbean (IDA & IBRD countries)LatviaLeast developed countries: UN classificationLebanonLesothoLiberiaLibyaLithuaniaLow & middle incomeLow incomeLower middle incomeLuxembourgMacao SAR, ChinaMacedonia, FYRMadagascarMalawiMalaysiaMaldivesMaliMaltaMarshall IslandsMauritaniaMauritiusMexicoMicronesia, Fed. Sts.Middle East & North AfricaMiddle East & North Africa (excluding high income)Middle East & North Africa (IDA & IBRD countries)Middle incomeMoldovaMongoliaMontenegroMoroccoMozambiqueMyanmarNamibiaNepalNetherlandsNew CaledoniaNew ZealandNicaraguaNigerNigeriaNorth AmericaNorwayOECD membersOmanOther small statesPacific island small statesPakistanPalauPanamaPapua New GuineaParaguayPeruPhilippinesPolandPortugalPost-demographic dividendPre-demographic dividendQatarRomaniaRussian FederationRwandaSamoaSao Tome and PrincipeSaudi ArabiaSenegalSerbiaSeychellesSierra LeoneSingaporeSint Maarten (Dutch part)Slovak RepublicSloveniaSmall statesSolomon IslandsSouth AfricaSouth AsiaSouth Asia (IDA & IBRD)South SudanSpainSri LankaSt. Kitts and NevisSt. LuciaSt. Vincent and the GrenadinesSub-Saharan Africa Sub-Saharan Africa (excluding high income)Sub-Saharan Africa (IDA & IBRD countries)SudanSurinameSwazilandSwedenSwitzerlandSyrian Arab RepublicTajikistanTanzaniaThailandTimor-LesteTogoTongaTrinidad and TobagoTunisiaTurkeyTuvaluUgandaUkraineUnited KingdomUnited StatesUpper middle incomeUruguayVanuatuVenezuela, RBVietnamWest Bank and GazaWorldYemen, Rep.ZambiaZimbabwe Timeline:
This timeline shows a graph from 1977 to 2016 of Bangladesh. No data until 1976. Number of actual observations by date: 40.
Source name:
World Development Indicators
Source organization:
International Monetary Fund, Balance of Payments Statistics Yearbook and data files.
Categories, topics:
Economy & Growth
Last updated:
apr 23, 2017
Indicators value changes by year
Minimum:
228.825 mln
jan 1, 1977
Maximum:
15.958 bln
jan 1, 2016
At the date of observation
Value
Absolute change
Change from previous value
jan 1, 1977
228.825 mln
+228.825 mln
0.0%
jan 1, 1978
415.094 mln
+186.27 mln
81.4%
jan 1, 1979
585.816 mln
+170.722 mln
41.13%
jan 1, 1980
895.558 mln
+309.742 mln
52.87%
jan 1, 1981
1.121 bln
+225.411 mln
25.17%
jan 1, 1982
935.753 mln
-185.216 mln
-16.52%
jan 1, 1983
1.299 bln
+363.145 mln
38.81%
jan 1, 1984
1.432 bln
+133.389 mln
10.27%
jan 1, 1985
1.269 bln
-163.321 mln
-11.4%
jan 1, 1986
1.184 bln
-84.636 mln
-6.67%
jan 1, 1987
1.219 bln
+35.0 mln
2.96%
jan 1, 1988
1.503 bln
+284.062 mln
23.3%
jan 1, 1989
1.633 bln
+129.979 mln
8.65%
jan 1, 1990
1.397 bln
-236.75 mln
-14.49%
jan 1, 1991
1.614 bln
+217.541 mln
15.58%
jan 1, 1992
1.812 bln
+197.746 mln
12.25%
jan 1, 1993
1.809 bln
-3.149 mln
-0.17%
jan 1, 1994
1.952 bln
+143.011 mln
7.91%
jan 1, 1995
2.091 bln
+139.587 mln
7.15%
jan 1, 1996
2.267 bln
+175.392 mln
8.39%
jan 1, 1997
1.913 bln
-353.963 mln
-15.62%
jan 1, 1998
2.137 bln
+223.738 mln
11.7%
jan 1, 1999
2.173 bln
+36.353 mln
1.7%
jan 1, 2000
2.501 bln
+328.501 mln
15.12%
jan 1, 2001
2.426 bln
-74.905 mln
-2.99%
jan 1, 2002
2.573 bln
+146.289 mln
6.03%
jan 1, 2003
3.245 bln
+672.608 mln
26.14%
jan 1, 2004
3.586 bln
+340.847 mln
10.5%
jan 1, 2005
3.96 bln
+374.233 mln
10.44%
jan 1, 2006
5.166 bln
+1.206 bln
30.44%
jan 1, 2007
5.941 bln
+775.127 mln
15.0%
jan 1, 2008
7.297 bln
+1.356 bln
22.83%
jan 1, 2009
9.768 bln
+2.471 bln
33.86%
jan 1, 2010
11.247 bln
+1.479 bln
15.14%
jan 1, 2011
11.741 bln
+493.925 mln
4.39%
jan 1, 2012
12.727 bln
+986.621 mln
8.4%
jan 1, 2013
14.792 bln
+2.064 bln
16.22%
jan 1, 2014
14.552 bln
-239.557 mln
-1.62%
jan 1, 2015
15.68 bln
+1.128 bln
7.75%
jan 1, 2016
15.958 bln
+278.327 mln
1.78%
Ranking of countries by current statistics by years


Comments: