29
/
en
AIzaSyAYiBZKx7MnpbEhh9jyipgxe19OcubqV5w
April 1, 2024
145087
Guatemala
GTM
true
2
1
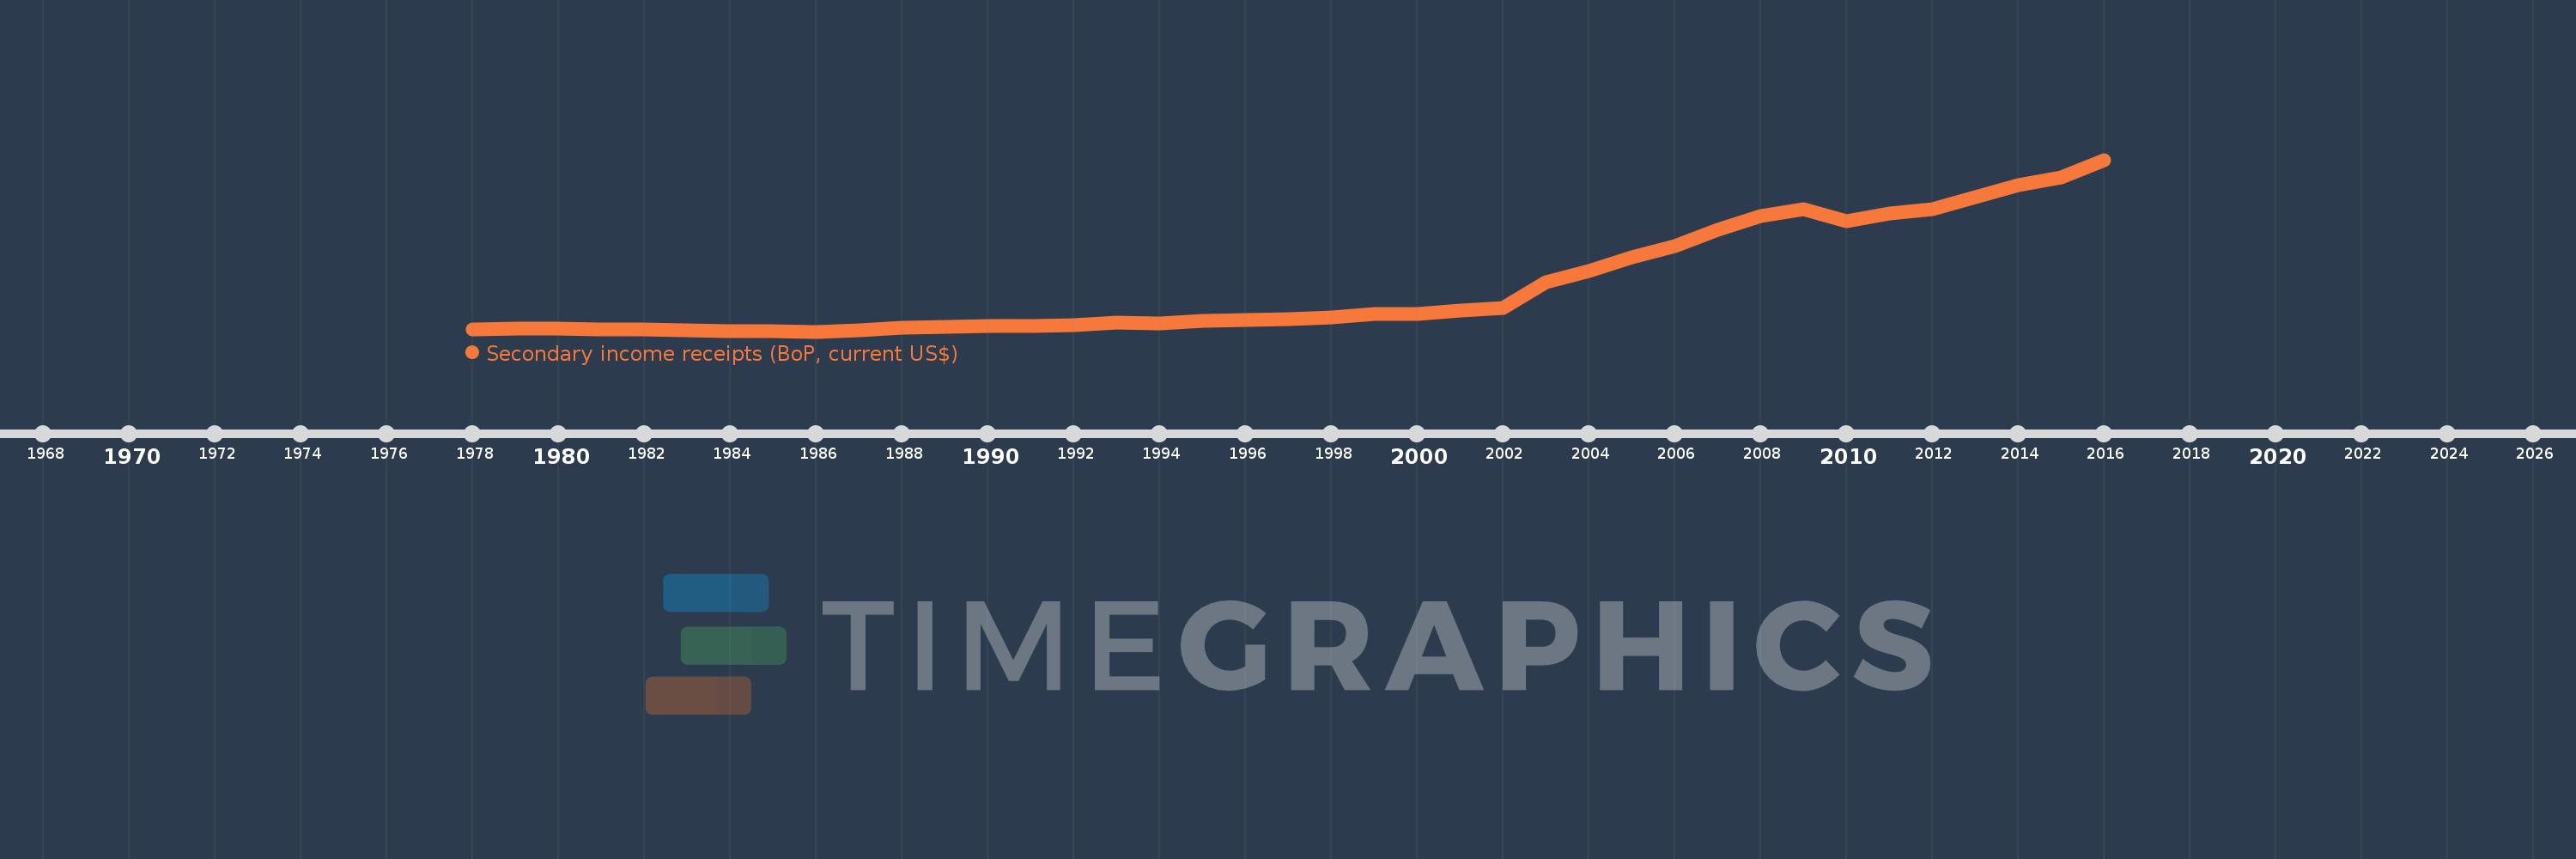
Secondary income receipts (BoP, current US$)
2016,2015,2014,2013,2012,2011,2010,2009,2008,2007,2006,2005,2004,2003,2002,2001,2000,1999,1998,1997,1996,1995,1994,1993,1992,1991,1990,1989,1988,1987,1986,1985,1984,1983,1982,1981,1980,1979,1978
This statistics in other country:
AfghanistanAlbaniaAlgeriaAngolaAntigua and BarbudaArab WorldArgentinaArmeniaArubaAustraliaAustriaAzerbaijanBahamas, TheBahrainBangladeshBarbadosBelarusBelgiumBelizeBeninBermudaBhutanBoliviaBosnia and HerzegovinaBotswanaBrazilBrunei DarussalamBulgariaBurkina FasoBurundiCabo VerdeCambodiaCameroonCanadaCaribbean small statesCentral African RepublicCentral Europe and the BalticsChadChileChinaColombiaComorosCongo, Dem. Rep.Congo, Rep.Costa RicaCote d'IvoireCroatiaCuracaoCyprusCzech RepublicDenmarkDjiboutiDominicaDominican RepublicEarly-demographic dividendEast Asia & PacificEast Asia & Pacific (excluding high income)East Asia & Pacific (IDA & IBRD countries)EcuadorEgypt, Arab Rep.El SalvadorEquatorial GuineaEritreaEstoniaEthiopiaEuro areaEurope & Central AsiaEurope & Central Asia (excluding high income)Europe & Central Asia (IDA & IBRD countries)European UnionFaroe IslandsFijiFinlandFragile and conflict affected situationsFranceFrench PolynesiaGabonGambia, TheGeorgiaGermanyGhanaGreeceGrenadaGuatemalaGuineaGuinea-BissauGuyanaHaitiHeavily indebted poor countries (HIPC)High incomeHondurasHong Kong SAR, ChinaHungaryIBRD onlyIcelandIDA & IBRD totalIDA blendIDA onlyIDA totalIndiaIndonesiaIran, Islamic Rep.IraqIrelandIsraelItalyJamaicaJapanJordanKazakhstanKenyaKiribatiKorea, Rep.KosovoKuwaitKyrgyz RepublicLao PDRLate-demographic dividendLatin America & Caribbean Latin America & Caribbean (excluding high income)Latin America & the Caribbean (IDA & IBRD countries)LatviaLeast developed countries: UN classificationLebanonLesothoLiberiaLibyaLithuaniaLow & middle incomeLow incomeLower middle incomeLuxembourgMacao SAR, ChinaMacedonia, FYRMadagascarMalawiMalaysiaMaldivesMaliMaltaMarshall IslandsMauritaniaMauritiusMexicoMicronesia, Fed. Sts.Middle East & North AfricaMiddle East & North Africa (excluding high income)Middle East & North Africa (IDA & IBRD countries)Middle incomeMoldovaMongoliaMontenegroMoroccoMozambiqueMyanmarNamibiaNepalNetherlandsNew CaledoniaNew ZealandNicaraguaNigerNigeriaNorth AmericaNorwayOECD membersOmanOther small statesPacific island small statesPakistanPalauPanamaPapua New GuineaParaguayPeruPhilippinesPolandPortugalPost-demographic dividendPre-demographic dividendQatarRomaniaRussian FederationRwandaSamoaSao Tome and PrincipeSaudi ArabiaSenegalSerbiaSeychellesSierra LeoneSingaporeSint Maarten (Dutch part)Slovak RepublicSloveniaSmall statesSolomon IslandsSouth AfricaSouth AsiaSouth Asia (IDA & IBRD)South SudanSpainSri LankaSt. Kitts and NevisSt. LuciaSt. Vincent and the GrenadinesSub-Saharan Africa Sub-Saharan Africa (excluding high income)Sub-Saharan Africa (IDA & IBRD countries)SudanSurinameSwazilandSwedenSwitzerlandSyrian Arab RepublicTajikistanTanzaniaThailandTimor-LesteTogoTongaTrinidad and TobagoTunisiaTurkeyTuvaluUgandaUkraineUnited KingdomUnited StatesUpper middle incomeUruguayVanuatuVenezuela, RBVietnamWest Bank and GazaWorldYemen, Rep.ZambiaZimbabwe Timeline:
This timeline shows a graph from 1978 to 2016 of Guatemala. No data until 1977. Number of actual observations by date: 39.
Source name:
World Development Indicators
Source organization:
International Monetary Fund, Balance of Payments Statistics Yearbook and data files.
Categories, topics:
Economy & Growth
Last updated:
apr 23, 2017
Indicators value changes by year
Minimum:
21.0 mln
jan 1, 1986
Maximum:
7.233 bln
jan 1, 2016
At the date of observation
Value
Absolute change
Change from previous value
jan 1, 1978
116.4 mln
+116.4 mln
0.0%
jan 1, 1979
139.4 mln
+23.0 mln
19.76%
jan 1, 1980
149.5 mln
+10.1 mln
7.25%
jan 1, 1981
125.3 mln
-24.2 mln
-16.19%
jan 1, 1982
96.9 mln
-28.4 mln
-22.67%
jan 1, 1983
66.1 mln
-30.8 mln
-31.79%
jan 1, 1984
34.2 mln
-31.9 mln
-48.26%
jan 1, 1985
31.6 mln
-2.6 mln
-7.6%
jan 1, 1986
21.0 mln
-10.6 mln
-33.54%
jan 1, 1987
76.2 mln
+55.2 mln
262.86%
jan 1, 1988
195.9 mln
+119.7 mln
157.09%
jan 1, 1989
227.7 mln
+31.8 mln
16.23%
jan 1, 1990
255.1 mln
+27.4 mln
12.03%
jan 1, 1991
237.6 mln
-17.5 mln
-6.86%
jan 1, 1992
276.7 mln
+39.1 mln
16.46%
jan 1, 1993
406.2 mln
+129.5 mln
46.8%
jan 1, 1994
371.4 mln
-34.8 mln
-8.57%
jan 1, 1995
456.4 mln
+85.0 mln
22.89%
jan 1, 1996
508.2 mln
+51.8 mln
11.35%
jan 1, 1997
537.1 mln
+28.9 mln
5.69%
jan 1, 1998
628.8 mln
+91.7 mln
17.07%
jan 1, 1999
742.9 mln
+114.1 mln
18.15%
jan 1, 2000
754.4 mln
+11.5 mln
1.55%
jan 1, 2001
908.2 mln
+153.8 mln
20.39%
jan 1, 2002
1.024 bln
+116.102 mln
12.78%
jan 1, 2003
2.078 bln
+1.053 bln
102.84%
jan 1, 2004
2.559 bln
+481.12 mln
23.16%
jan 1, 2005
3.157 bln
+598.049 mln
23.37%
jan 1, 2006
3.615 bln
+458.0 mln
14.51%
jan 1, 2007
4.306 bln
+690.8 mln
19.11%
jan 1, 2008
4.865 bln
+559.5 mln
12.99%
jan 1, 2009
5.149 bln
+283.924 mln
5.84%
jan 1, 2010
4.644 bln
-505.068 mln
-9.81%
jan 1, 2011
4.97 bln
+325.985 mln
7.02%
jan 1, 2012
5.166 bln
+195.73 mln
3.94%
jan 1, 2013
5.675 bln
+508.855 mln
9.85%
jan 1, 2014
6.152 bln
+477.324 mln
8.41%
jan 1, 2015
6.481 bln
+329.53 mln
5.36%
jan 1, 2016
7.233 bln
+751.178 mln
11.59%
Ranking of countries by current statistics by years


Comments: