29
/
en
AIzaSyAYiBZKx7MnpbEhh9jyipgxe19OcubqV5w
April 1, 2024
53034
OECD members
OED
false
2
1
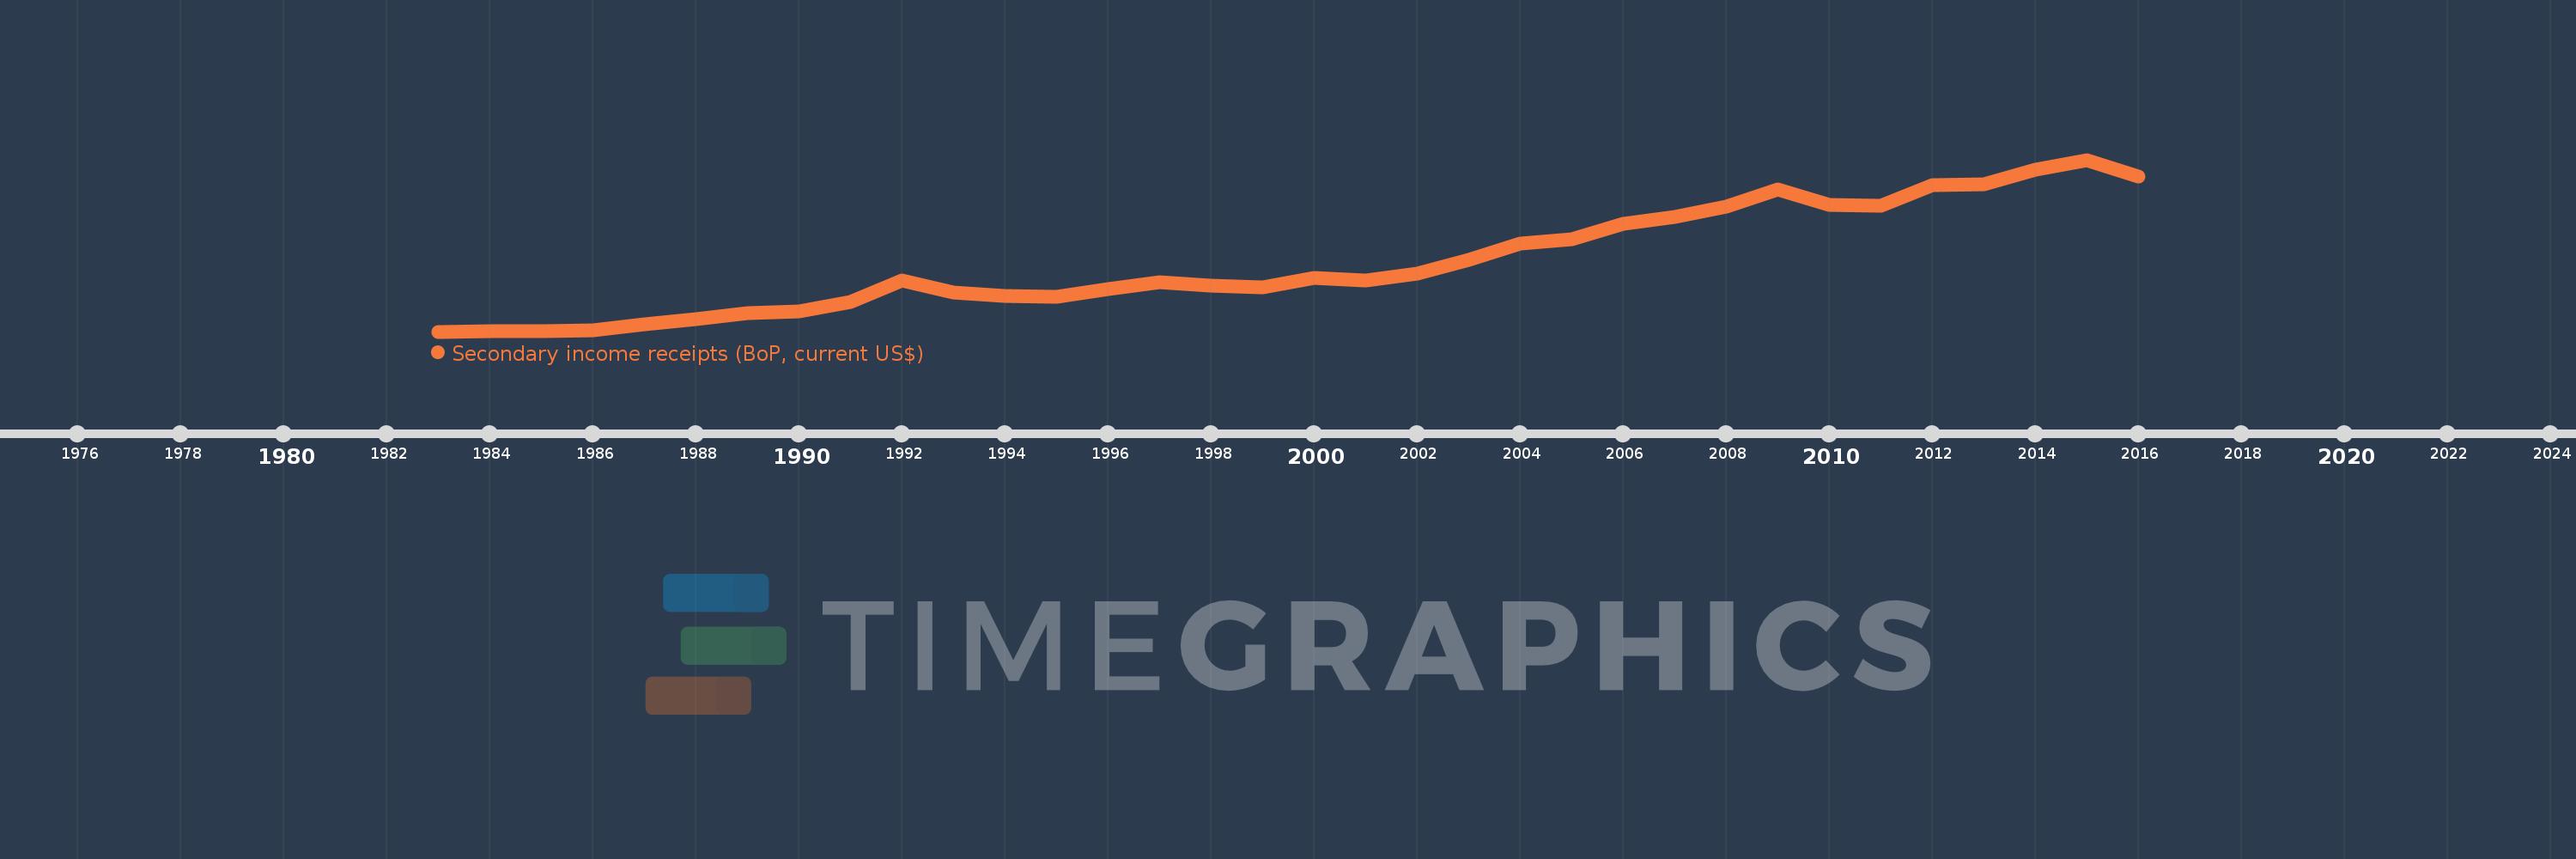
Secondary income receipts (BoP, current US$)
2016,2015,2014,2013,2012,2011,2010,2009,2008,2007,2006,2005,2004,2003,2002,2001,2000,1999,1998,1997,1996,1995,1994,1993,1992,1991,1990,1989,1988,1987,1986,1985,1984,1983
This statistics in other country:
AfghanistanAlbaniaAlgeriaAngolaAntigua and BarbudaArab WorldArgentinaArmeniaArubaAustraliaAustriaAzerbaijanBahamas, TheBahrainBangladeshBarbadosBelarusBelgiumBelizeBeninBermudaBhutanBoliviaBosnia and HerzegovinaBotswanaBrazilBrunei DarussalamBulgariaBurkina FasoBurundiCabo VerdeCambodiaCameroonCanadaCaribbean small statesCentral African RepublicCentral Europe and the BalticsChadChileChinaColombiaComorosCongo, Dem. Rep.Congo, Rep.Costa RicaCote d'IvoireCroatiaCuracaoCyprusCzech RepublicDenmarkDjiboutiDominicaDominican RepublicEarly-demographic dividendEast Asia & PacificEast Asia & Pacific (excluding high income)East Asia & Pacific (IDA & IBRD countries)EcuadorEgypt, Arab Rep.El SalvadorEquatorial GuineaEritreaEstoniaEthiopiaEuro areaEurope & Central AsiaEurope & Central Asia (excluding high income)Europe & Central Asia (IDA & IBRD countries)European UnionFaroe IslandsFijiFinlandFragile and conflict affected situationsFranceFrench PolynesiaGabonGambia, TheGeorgiaGermanyGhanaGreeceGrenadaGuatemalaGuineaGuinea-BissauGuyanaHaitiHeavily indebted poor countries (HIPC)High incomeHondurasHong Kong SAR, ChinaHungaryIBRD onlyIcelandIDA & IBRD totalIDA blendIDA onlyIDA totalIndiaIndonesiaIran, Islamic Rep.IraqIrelandIsraelItalyJamaicaJapanJordanKazakhstanKenyaKiribatiKorea, Rep.KosovoKuwaitKyrgyz RepublicLao PDRLate-demographic dividendLatin America & Caribbean Latin America & Caribbean (excluding high income)Latin America & the Caribbean (IDA & IBRD countries)LatviaLeast developed countries: UN classificationLebanonLesothoLiberiaLibyaLithuaniaLow & middle incomeLow incomeLower middle incomeLuxembourgMacao SAR, ChinaMacedonia, FYRMadagascarMalawiMalaysiaMaldivesMaliMaltaMarshall IslandsMauritaniaMauritiusMexicoMicronesia, Fed. Sts.Middle East & North AfricaMiddle East & North Africa (excluding high income)Middle East & North Africa (IDA & IBRD countries)Middle incomeMoldovaMongoliaMontenegroMoroccoMozambiqueMyanmarNamibiaNepalNetherlandsNew CaledoniaNew ZealandNicaraguaNigerNigeriaNorth AmericaNorwayOECD membersOmanOther small statesPacific island small statesPakistanPalauPanamaPapua New GuineaParaguayPeruPhilippinesPolandPortugalPost-demographic dividendPre-demographic dividendQatarRomaniaRussian FederationRwandaSamoaSao Tome and PrincipeSaudi ArabiaSenegalSerbiaSeychellesSierra LeoneSingaporeSint Maarten (Dutch part)Slovak RepublicSloveniaSmall statesSolomon IslandsSouth AfricaSouth AsiaSouth Asia (IDA & IBRD)South SudanSpainSri LankaSt. Kitts and NevisSt. LuciaSt. Vincent and the GrenadinesSub-Saharan Africa Sub-Saharan Africa (excluding high income)Sub-Saharan Africa (IDA & IBRD countries)SudanSurinameSwazilandSwedenSwitzerlandSyrian Arab RepublicTajikistanTanzaniaThailandTimor-LesteTogoTongaTrinidad and TobagoTunisiaTurkeyTuvaluUgandaUkraineUnited KingdomUnited StatesUpper middle incomeUruguayVanuatuVenezuela, RBVietnamWest Bank and GazaWorldYemen, Rep.ZambiaZimbabwe Timeline:
This timeline shows a graph from 1983 to 2016 of OECD members. No data until 1982. Number of actual observations by date: 34.
Source name:
World Development Indicators
Source organization:
International Monetary Fund, Balance of Payments Statistics Yearbook and data files.
Categories, topics:
Economy & Growth
Last updated:
apr 23, 2017
Indicators value changes by year
Minimum:
41.573 bln
jan 1, 1983
Maximum:
527.738 bln
jan 1, 2015
At the date of observation
Value
Absolute change
Change from previous value
jan 1, 1983
41.573 bln
+41.573 bln
0.0%
jan 1, 1984
42.483 bln
+909.866 mln
2.19%
jan 1, 1985
42.932 bln
+449.391 mln
1.06%
jan 1, 1986
46.193 bln
+3.26 bln
7.59%
jan 1, 1987
61.492 bln
+15.299 bln
33.12%
jan 1, 1988
76.484 bln
+14.992 bln
24.38%
jan 1, 1989
93.581 bln
+17.097 bln
22.35%
jan 1, 1990
98.261 bln
+4.681 bln
5.0%
jan 1, 1991
125.312 bln
+27.05 bln
27.53%
jan 1, 1992
186.126 bln
+60.814 bln
48.53%
jan 1, 1993
152.752 bln
-33.373 bln
-17.93%
jan 1, 1994
141.93 bln
-10.823 bln
-7.09%
jan 1, 1995
139.982 bln
-1.948 bln
-1.37%
jan 1, 1996
161.841 bln
+21.859 bln
15.62%
jan 1, 1997
182.122 bln
+20.281 bln
12.53%
jan 1, 1998
171.515 bln
-10.606 bln
-5.82%
jan 1, 1999
167.452 bln
-4.063 bln
-2.37%
jan 1, 2000
193.438 bln
+25.986 bln
15.52%
jan 1, 2001
185.869 bln
-7.569 bln
-3.91%
jan 1, 2002
205.086 bln
+19.217 bln
10.34%
jan 1, 2003
244.692 bln
+39.606 bln
19.31%
jan 1, 2004
290.781 bln
+46.088 bln
18.84%
jan 1, 2005
303.407 bln
+12.626 bln
4.34%
jan 1, 2006
347.841 bln
+44.434 bln
14.65%
jan 1, 2007
367.116 bln
+19.275 bln
5.54%
jan 1, 2008
394.872 bln
+27.757 bln
7.56%
jan 1, 2009
445.013 bln
+50.14 bln
12.7%
jan 1, 2010
399.047 bln
-45.966 bln
-10.33%
jan 1, 2011
398.542 bln
-504.952 mln
-0.13%
jan 1, 2012
454.954 bln
+56.412 bln
14.15%
jan 1, 2013
458.825 bln
+3.871 bln
0.85%
jan 1, 2014
500.484 bln
+41.659 bln
9.08%
jan 1, 2015
527.738 bln
+27.255 bln
5.45%
jan 1, 2016
480.446 bln
-47.292 bln
-8.96%
Ranking of countries by current statistics by years


Comments: