29
/
en
AIzaSyAYiBZKx7MnpbEhh9jyipgxe19OcubqV5w
April 1, 2024
175846
Latvia
LVA
true
2
1
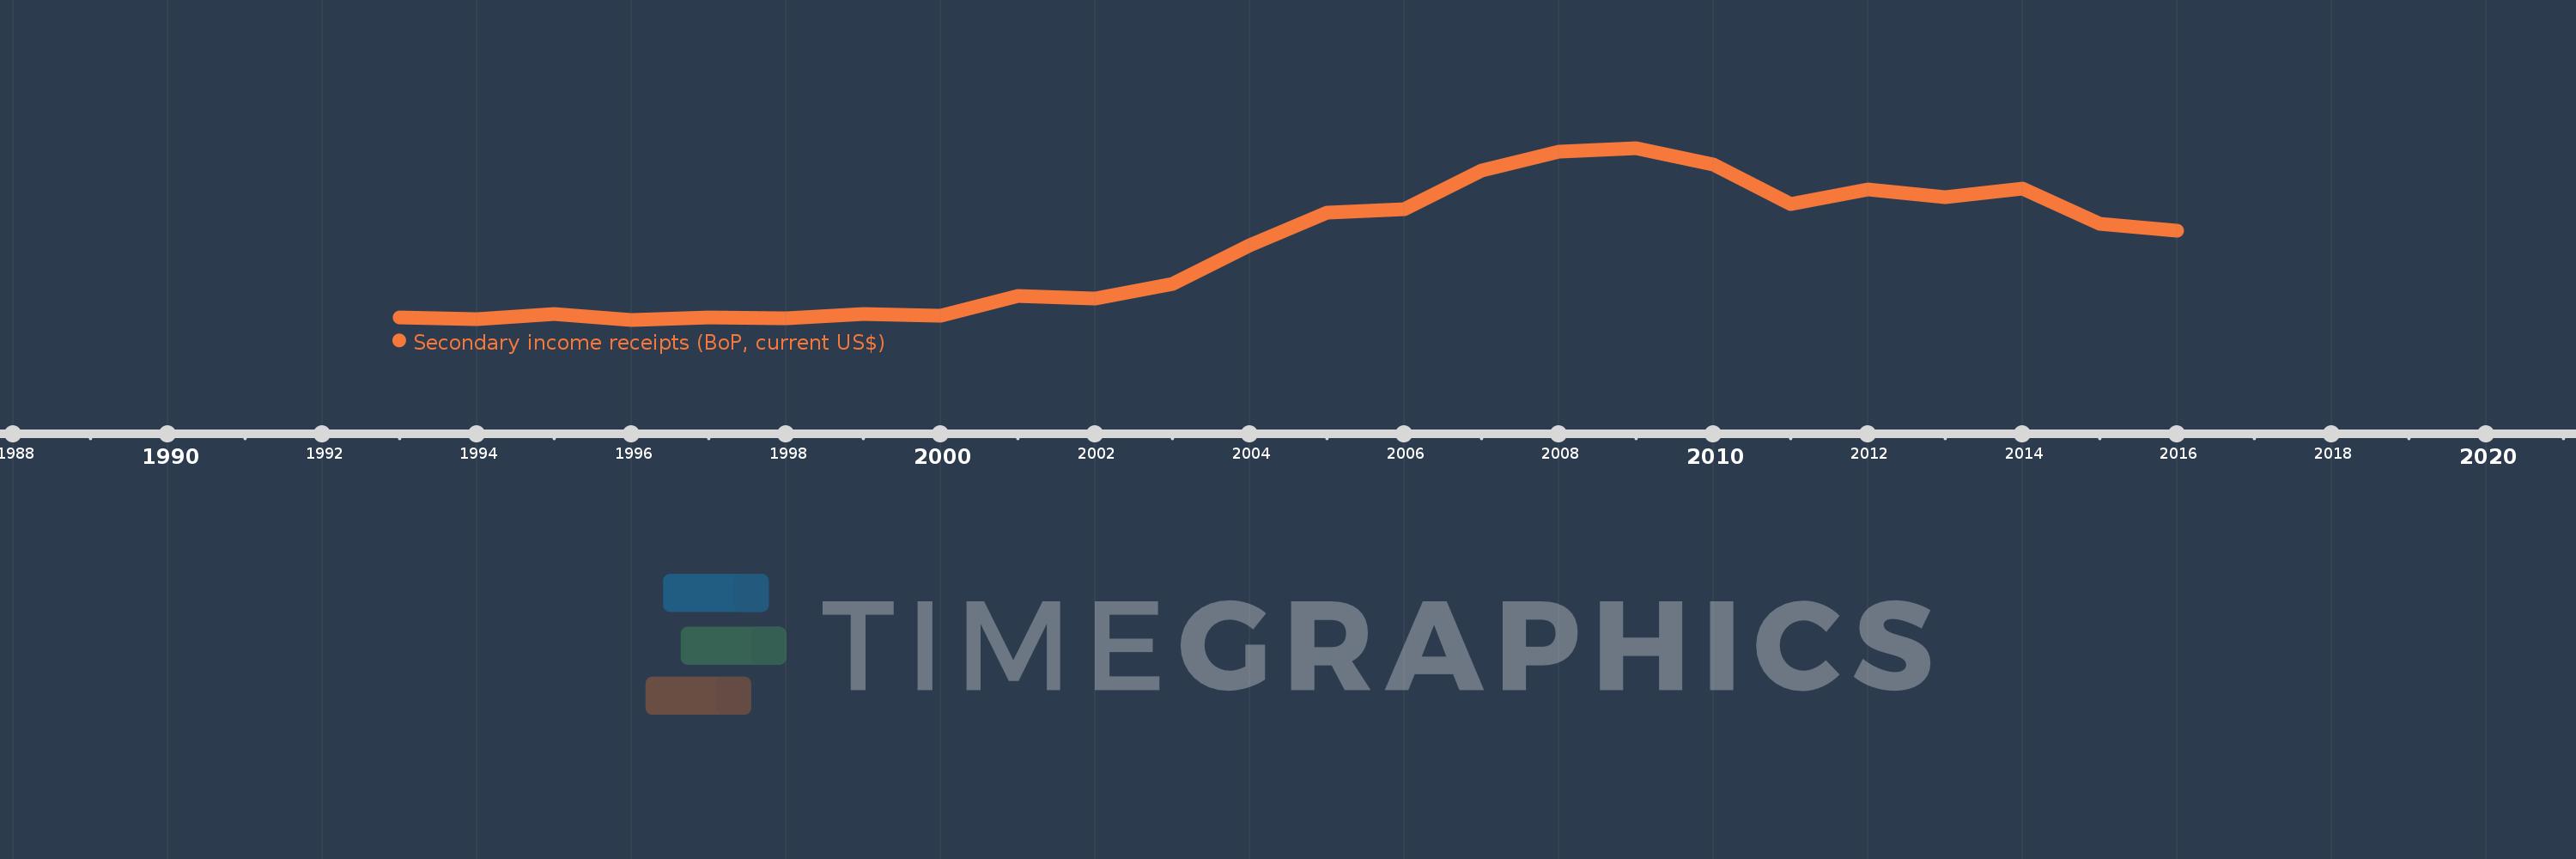
Secondary income receipts (BoP, current US$)
2016,2015,2014,2013,2012,2011,2010,2009,2008,2007,2006,2005,2004,2003,2002,2001,2000,1999,1998,1997,1996,1995,1994,1993
This statistics in other country:
AfghanistanAlbaniaAlgeriaAngolaAntigua and BarbudaArab WorldArgentinaArmeniaArubaAustraliaAustriaAzerbaijanBahamas, TheBahrainBangladeshBarbadosBelarusBelgiumBelizeBeninBermudaBhutanBoliviaBosnia and HerzegovinaBotswanaBrazilBrunei DarussalamBulgariaBurkina FasoBurundiCabo VerdeCambodiaCameroonCanadaCaribbean small statesCentral African RepublicCentral Europe and the BalticsChadChileChinaColombiaComorosCongo, Dem. Rep.Congo, Rep.Costa RicaCote d'IvoireCroatiaCuracaoCyprusCzech RepublicDenmarkDjiboutiDominicaDominican RepublicEarly-demographic dividendEast Asia & PacificEast Asia & Pacific (excluding high income)East Asia & Pacific (IDA & IBRD countries)EcuadorEgypt, Arab Rep.El SalvadorEquatorial GuineaEritreaEstoniaEthiopiaEuro areaEurope & Central AsiaEurope & Central Asia (excluding high income)Europe & Central Asia (IDA & IBRD countries)European UnionFaroe IslandsFijiFinlandFragile and conflict affected situationsFranceFrench PolynesiaGabonGambia, TheGeorgiaGermanyGhanaGreeceGrenadaGuatemalaGuineaGuinea-BissauGuyanaHaitiHeavily indebted poor countries (HIPC)High incomeHondurasHong Kong SAR, ChinaHungaryIBRD onlyIcelandIDA & IBRD totalIDA blendIDA onlyIDA totalIndiaIndonesiaIran, Islamic Rep.IraqIrelandIsraelItalyJamaicaJapanJordanKazakhstanKenyaKiribatiKorea, Rep.KosovoKuwaitKyrgyz RepublicLao PDRLate-demographic dividendLatin America & Caribbean Latin America & Caribbean (excluding high income)Latin America & the Caribbean (IDA & IBRD countries)LatviaLeast developed countries: UN classificationLebanonLesothoLiberiaLibyaLithuaniaLow & middle incomeLow incomeLower middle incomeLuxembourgMacao SAR, ChinaMacedonia, FYRMadagascarMalawiMalaysiaMaldivesMaliMaltaMarshall IslandsMauritaniaMauritiusMexicoMicronesia, Fed. Sts.Middle East & North AfricaMiddle East & North Africa (excluding high income)Middle East & North Africa (IDA & IBRD countries)Middle incomeMoldovaMongoliaMontenegroMoroccoMozambiqueMyanmarNamibiaNepalNetherlandsNew CaledoniaNew ZealandNicaraguaNigerNigeriaNorth AmericaNorwayOECD membersOmanOther small statesPacific island small statesPakistanPalauPanamaPapua New GuineaParaguayPeruPhilippinesPolandPortugalPost-demographic dividendPre-demographic dividendQatarRomaniaRussian FederationRwandaSamoaSao Tome and PrincipeSaudi ArabiaSenegalSerbiaSeychellesSierra LeoneSingaporeSint Maarten (Dutch part)Slovak RepublicSloveniaSmall statesSolomon IslandsSouth AfricaSouth AsiaSouth Asia (IDA & IBRD)South SudanSpainSri LankaSt. Kitts and NevisSt. LuciaSt. Vincent and the GrenadinesSub-Saharan Africa Sub-Saharan Africa (excluding high income)Sub-Saharan Africa (IDA & IBRD countries)SudanSurinameSwazilandSwedenSwitzerlandSyrian Arab RepublicTajikistanTanzaniaThailandTimor-LesteTogoTongaTrinidad and TobagoTunisiaTurkeyTuvaluUgandaUkraineUnited KingdomUnited StatesUpper middle incomeUruguayVanuatuVenezuela, RBVietnamWest Bank and GazaWorldYemen, Rep.ZambiaZimbabwe Timeline:
This timeline shows a graph from 1993 to 2016 of Latvia. No data until 1992. Number of actual observations by date: 24.
Source name:
World Development Indicators
Source organization:
International Monetary Fund, Balance of Payments Statistics Yearbook and data files.
Categories, topics:
Economy & Growth
Last updated:
apr 23, 2017
Indicators value changes by year
Minimum:
75.359 mln
jan 1, 1996
Maximum:
1.861 bln
jan 1, 2009
At the date of observation
Value
Absolute change
Change from previous value
jan 1, 1993
96.836 mln
+96.836 mln
0.0%
jan 1, 1994
80.512 mln
-16.324 mln
-16.86%
jan 1, 1995
135.738 mln
+55.226 mln
68.59%
jan 1, 1996
75.359 mln
-60.379 mln
-44.48%
jan 1, 1997
98.097 mln
+22.738 mln
30.17%
jan 1, 1998
90.939 mln
-7.158 mln
-7.3%
jan 1, 1999
137.3 mln
+46.361 mln
50.98%
jan 1, 2000
113.8 mln
-23.5 mln
-17.12%
jan 1, 2001
323.452 mln
+209.652 mln
184.23%
jan 1, 2002
298.572 mln
-24.881 mln
-7.69%
jan 1, 2003
447.541 mln
+148.969 mln
49.89%
jan 1, 2004
850.185 mln
+402.644 mln
89.97%
jan 1, 2005
1.191 bln
+340.545 mln
40.06%
jan 1, 2006
1.226 bln
+34.793 mln
2.92%
jan 1, 2007
1.622 bln
+396.221 mln
32.33%
jan 1, 2008
1.822 bln
+200.629 mln
12.37%
jan 1, 2009
1.861 bln
+38.167 mln
2.09%
jan 1, 2010
1.685 bln
-175.495 mln
-9.43%
jan 1, 2011
1.277 bln
-407.836 mln
-24.2%
jan 1, 2012
1.428 bln
+150.392 mln
11.78%
jan 1, 2013
1.351 bln
-76.242 mln
-5.34%
jan 1, 2014
1.44 bln
+89.069 mln
6.59%
jan 1, 2015
1.075 bln
-365.14 mln
-25.35%
jan 1, 2016
1.001 bln
-74.132 mln
-6.89%
Ranking of countries by current statistics by years


Comments: