29
/
en
AIzaSyAYiBZKx7MnpbEhh9jyipgxe19OcubqV5w
April 1, 2024
214784
Norway
NOR
true
2
1
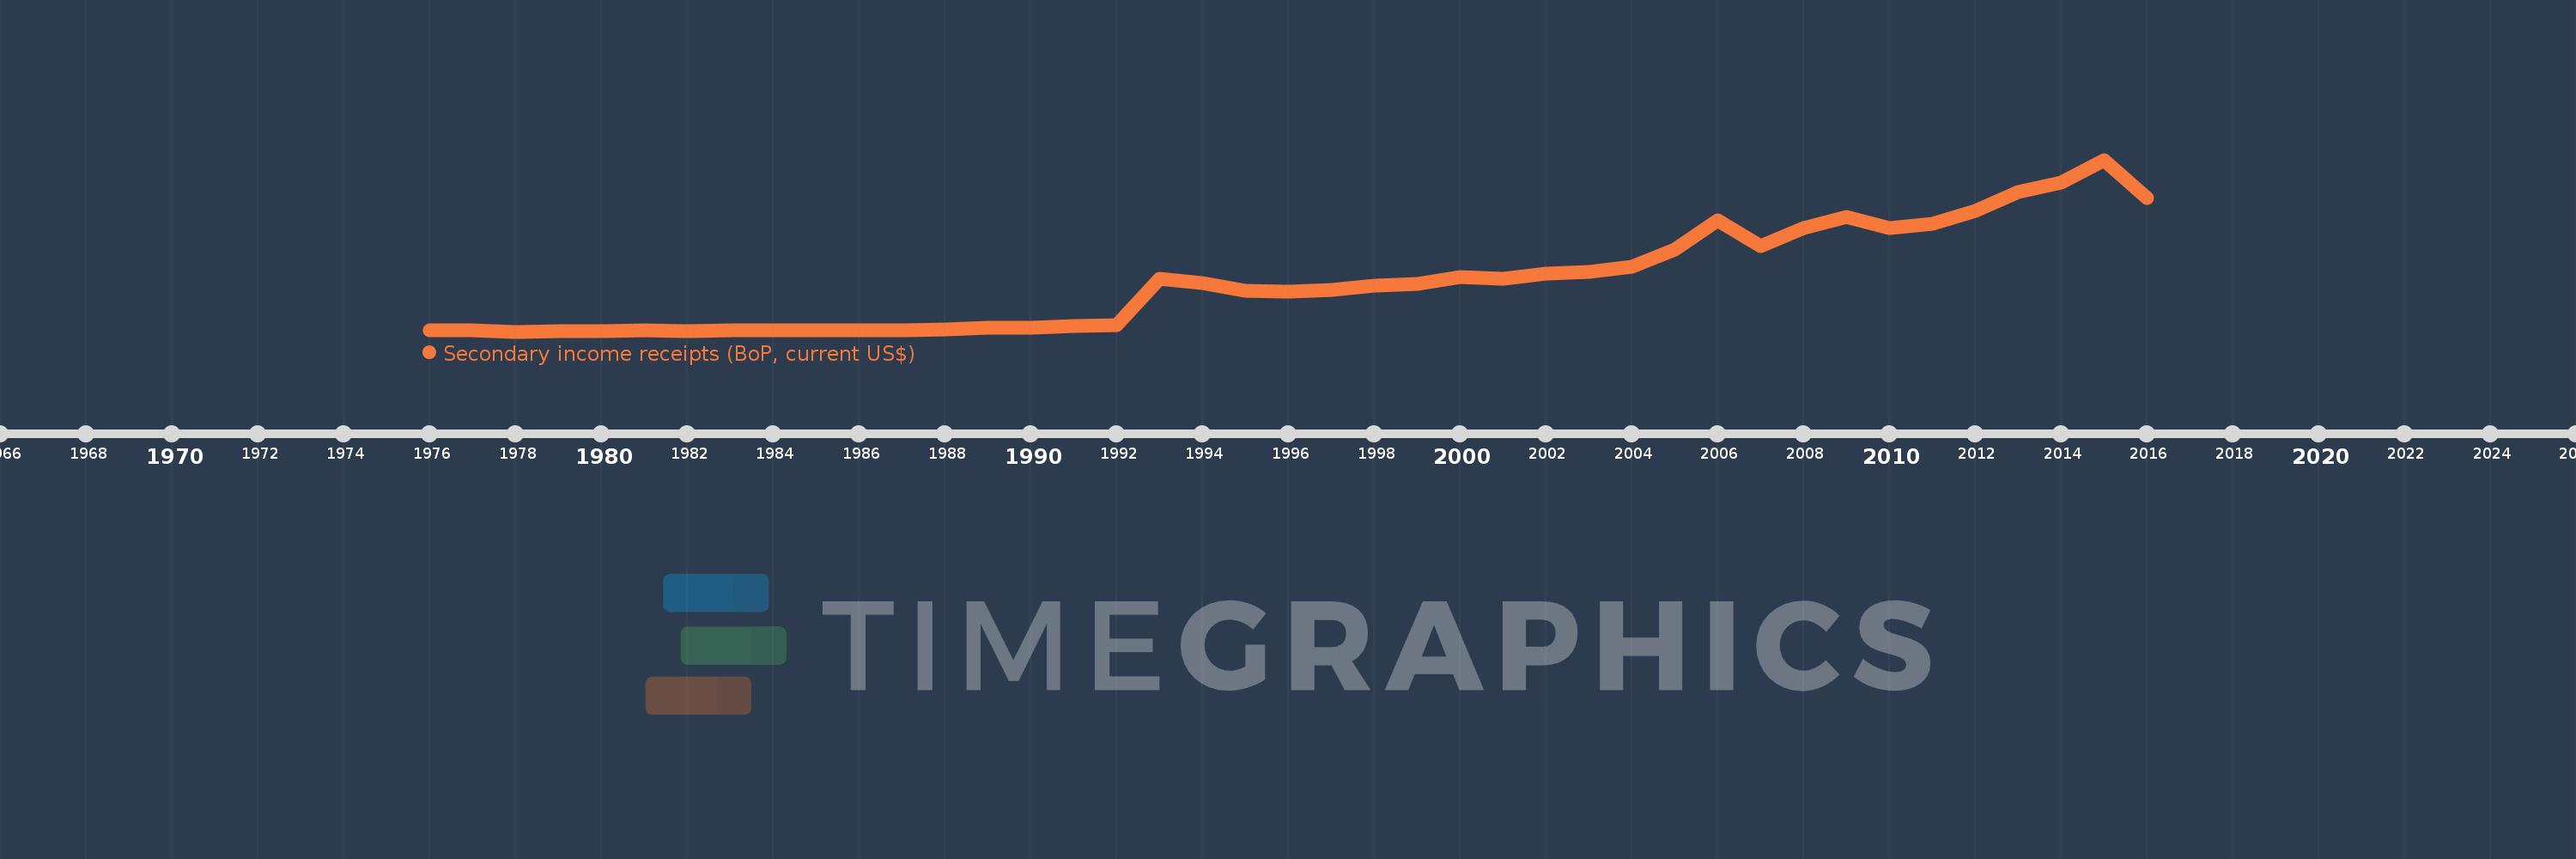
Secondary income receipts (BoP, current US$)
2016,2015,2014,2013,2012,2011,2010,2009,2008,2007,2006,2005,2004,2003,2002,2001,2000,1999,1998,1997,1996,1995,1994,1993,1992,1991,1990,1989,1988,1987,1986,1985,1984,1983,1982,1981,1980,1979,1978,1977,1976
This statistics in other country:
AfghanistanAlbaniaAlgeriaAngolaAntigua and BarbudaArab WorldArgentinaArmeniaArubaAustraliaAustriaAzerbaijanBahamas, TheBahrainBangladeshBarbadosBelarusBelgiumBelizeBeninBermudaBhutanBoliviaBosnia and HerzegovinaBotswanaBrazilBrunei DarussalamBulgariaBurkina FasoBurundiCabo VerdeCambodiaCameroonCanadaCaribbean small statesCentral African RepublicCentral Europe and the BalticsChadChileChinaColombiaComorosCongo, Dem. Rep.Congo, Rep.Costa RicaCote d'IvoireCroatiaCuracaoCyprusCzech RepublicDenmarkDjiboutiDominicaDominican RepublicEarly-demographic dividendEast Asia & PacificEast Asia & Pacific (excluding high income)East Asia & Pacific (IDA & IBRD countries)EcuadorEgypt, Arab Rep.El SalvadorEquatorial GuineaEritreaEstoniaEthiopiaEuro areaEurope & Central AsiaEurope & Central Asia (excluding high income)Europe & Central Asia (IDA & IBRD countries)European UnionFaroe IslandsFijiFinlandFragile and conflict affected situationsFranceFrench PolynesiaGabonGambia, TheGeorgiaGermanyGhanaGreeceGrenadaGuatemalaGuineaGuinea-BissauGuyanaHaitiHeavily indebted poor countries (HIPC)High incomeHondurasHong Kong SAR, ChinaHungaryIBRD onlyIcelandIDA & IBRD totalIDA blendIDA onlyIDA totalIndiaIndonesiaIran, Islamic Rep.IraqIrelandIsraelItalyJamaicaJapanJordanKazakhstanKenyaKiribatiKorea, Rep.KosovoKuwaitKyrgyz RepublicLao PDRLate-demographic dividendLatin America & Caribbean Latin America & Caribbean (excluding high income)Latin America & the Caribbean (IDA & IBRD countries)LatviaLeast developed countries: UN classificationLebanonLesothoLiberiaLibyaLithuaniaLow & middle incomeLow incomeLower middle incomeLuxembourgMacao SAR, ChinaMacedonia, FYRMadagascarMalawiMalaysiaMaldivesMaliMaltaMarshall IslandsMauritaniaMauritiusMexicoMicronesia, Fed. Sts.Middle East & North AfricaMiddle East & North Africa (excluding high income)Middle East & North Africa (IDA & IBRD countries)Middle incomeMoldovaMongoliaMontenegroMoroccoMozambiqueMyanmarNamibiaNepalNetherlandsNew CaledoniaNew ZealandNicaraguaNigerNigeriaNorth AmericaNorwayOECD membersOmanOther small statesPacific island small statesPakistanPalauPanamaPapua New GuineaParaguayPeruPhilippinesPolandPortugalPost-demographic dividendPre-demographic dividendQatarRomaniaRussian FederationRwandaSamoaSao Tome and PrincipeSaudi ArabiaSenegalSerbiaSeychellesSierra LeoneSingaporeSint Maarten (Dutch part)Slovak RepublicSloveniaSmall statesSolomon IslandsSouth AfricaSouth AsiaSouth Asia (IDA & IBRD)South SudanSpainSri LankaSt. Kitts and NevisSt. LuciaSt. Vincent and the GrenadinesSub-Saharan Africa Sub-Saharan Africa (excluding high income)Sub-Saharan Africa (IDA & IBRD countries)SudanSurinameSwazilandSwedenSwitzerlandSyrian Arab RepublicTajikistanTanzaniaThailandTimor-LesteTogoTongaTrinidad and TobagoTunisiaTurkeyTuvaluUgandaUkraineUnited KingdomUnited StatesUpper middle incomeUruguayVanuatuVenezuela, RBVietnamWest Bank and GazaWorldYemen, Rep.ZambiaZimbabwe Timeline:
This timeline shows a graph from 1976 to 2016 of Norway. No data until 1975. Number of actual observations by date: 41.
Source name:
World Development Indicators
Source organization:
International Monetary Fund, Balance of Payments Statistics Yearbook and data files.
Categories, topics:
Economy & Growth
Last updated:
apr 23, 2017
Indicators value changes by year
Minimum:
49.935 mln
jan 1, 1978
Maximum:
5.311 bln
jan 1, 2015
At the date of observation
Value
Absolute change
Change from previous value
jan 1, 1976
100.869 mln
+100.869 mln
0.0%
jan 1, 1977
97.078 mln
-3.791 mln
-3.76%
jan 1, 1978
49.935 mln
-47.143 mln
-48.56%
jan 1, 1979
54.702 mln
+4.766 mln
9.55%
jan 1, 1980
63.471 mln
+8.769 mln
16.03%
jan 1, 1981
77.534 mln
+14.064 mln
22.16%
jan 1, 1982
75.41 mln
-2.125 mln
-2.74%
jan 1, 1983
98.405 mln
+22.995 mln
30.49%
jan 1, 1984
96.944 mln
-1.461 mln
-1.48%
jan 1, 1985
87.154 mln
-9.79 mln
-10.1%
jan 1, 1986
84.49 mln
-2.664 mln
-3.06%
jan 1, 1987
95.444 mln
+10.954 mln
12.97%
jan 1, 1988
122.727 mln
+27.283 mln
28.59%
jan 1, 1989
167.84 mln
+45.113 mln
36.76%
jan 1, 1990
164.564 mln
-3.276 mln
-1.95%
jan 1, 1991
216.875 mln
+52.311 mln
31.79%
jan 1, 1992
239.39 mln
+22.516 mln
10.38%
jan 1, 1993
1.678 bln
+1.439 bln
601.02%
jan 1, 1994
1.533 bln
-144.932 mln
-8.64%
jan 1, 1995
1.291 bln
-242.176 mln
-15.8%
jan 1, 1996
1.28 bln
-10.852 mln
-0.84%
jan 1, 1997
1.329 bln
+49.009 mln
3.83%
jan 1, 1998
1.468 bln
+138.854 mln
10.45%
jan 1, 1999
1.5 bln
+32.374 mln
2.21%
jan 1, 2000
1.711 bln
+210.355 mln
14.02%
jan 1, 2001
1.657 bln
-53.339 mln
-3.12%
jan 1, 2002
1.815 bln
+157.741 mln
9.52%
jan 1, 2003
1.877 bln
+61.722 mln
3.4%
jan 1, 2004
2.049 bln
+171.678 mln
9.15%
jan 1, 2005
2.553 bln
+504.472 mln
24.63%
jan 1, 2006
3.458 bln
+904.78 mln
35.44%
jan 1, 2007
2.655 bln
-802.593 mln
-23.21%
jan 1, 2008
3.228 bln
+572.888 mln
21.58%
jan 1, 2009
3.56 bln
+331.952 mln
10.28%
jan 1, 2010
3.229 bln
-331.046 mln
-9.3%
jan 1, 2011
3.362 bln
+132.557 mln
4.11%
jan 1, 2012
3.747 bln
+385.238 mln
11.46%
jan 1, 2013
4.316 bln
+568.89 mln
15.18%
jan 1, 2014
4.604 bln
+287.96 mln
6.67%
jan 1, 2015
5.311 bln
+707.349 mln
15.36%
jan 1, 2016
4.136 bln
-1.175 bln
-22.13%
Ranking of countries by current statistics by years


Comments: