29
/
en
AIzaSyAYiBZKx7MnpbEhh9jyipgxe19OcubqV5w
April 1, 2024
70627
Argentina
ARG
true
2
1
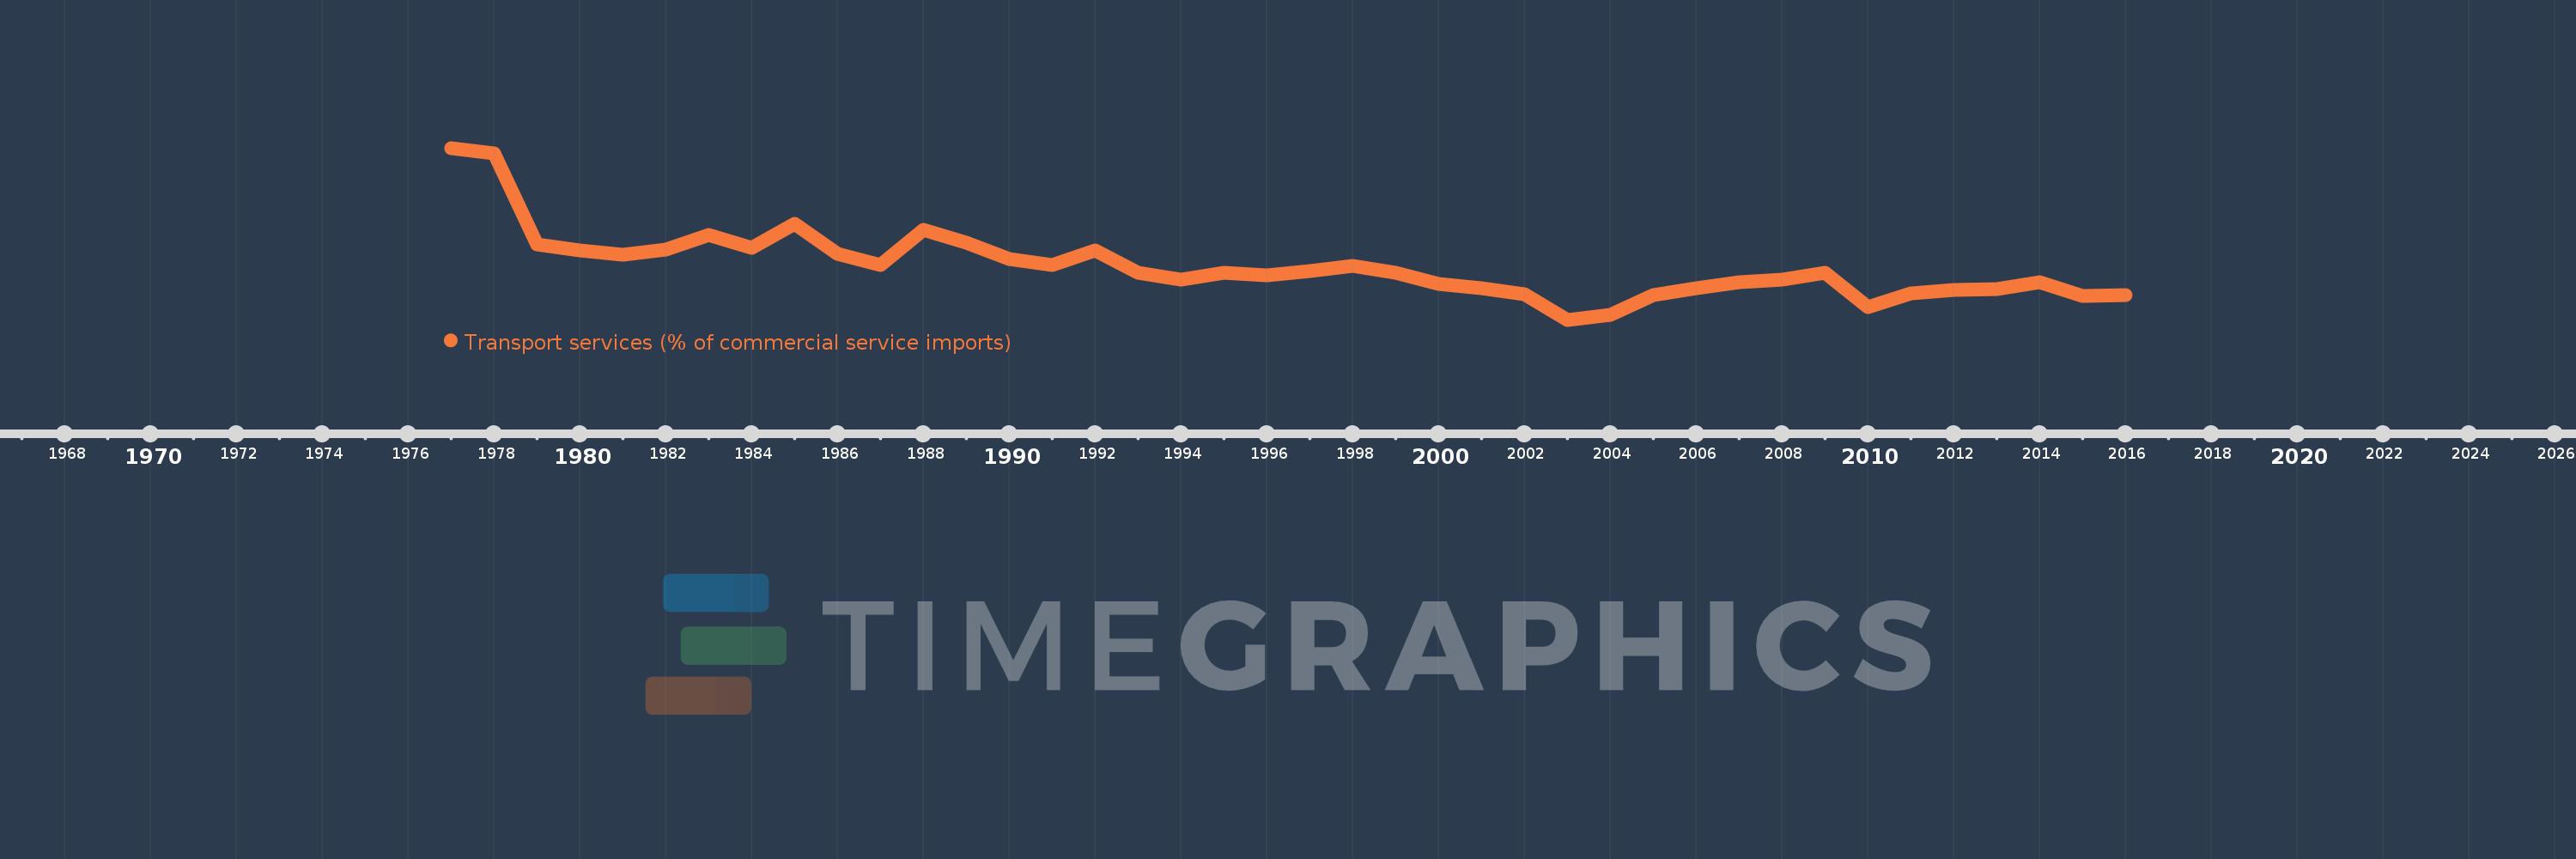
Transport services (% of commercial service imports)
2016,2015,2014,2013,2012,2011,2010,2009,2008,2007,2006,2005,2004,2003,2002,2001,2000,1999,1998,1997,1996,1995,1994,1993,1992,1991,1990,1989,1988,1987,1986,1985,1984,1983,1982,1981,1980,1979,1978,1977
This statistics in other country:
AfghanistanAlbaniaAlgeriaAngolaAntigua and BarbudaArab WorldArgentinaArmeniaArubaAustraliaAustriaAzerbaijanBahamas, TheBahrainBangladeshBarbadosBelarusBelgiumBelizeBeninBermudaBhutanBoliviaBosnia and HerzegovinaBotswanaBrazilBrunei DarussalamBulgariaBurkina FasoBurundiCabo VerdeCambodiaCameroonCanadaCaribbean small statesCentral African RepublicCentral Europe and the BalticsChadChileChinaColombiaComorosCongo, Dem. Rep.Congo, Rep.Costa RicaCote d'IvoireCroatiaCuracaoCyprusCzech RepublicDenmarkDjiboutiDominicaDominican RepublicEarly-demographic dividendEast Asia & PacificEast Asia & Pacific (excluding high income)East Asia & Pacific (IDA & IBRD countries)EcuadorEgypt, Arab Rep.El SalvadorEquatorial GuineaEritreaEstoniaEthiopiaEuro areaEurope & Central AsiaEurope & Central Asia (excluding high income)Europe & Central Asia (IDA & IBRD countries)European UnionFaroe IslandsFijiFinlandFragile and conflict affected situationsFranceFrench PolynesiaGabonGambia, TheGeorgiaGermanyGhanaGreeceGrenadaGuatemalaGuineaGuinea-BissauGuyanaHaitiHeavily indebted poor countries (HIPC)High incomeHondurasHong Kong SAR, ChinaHungaryIBRD onlyIcelandIDA & IBRD totalIDA onlyIDA totalIndiaIndonesiaIran, Islamic Rep.IraqIrelandIsraelItalyJamaicaJapanJordanKazakhstanKenyaKiribatiKorea, Rep.KosovoKuwaitKyrgyz RepublicLao PDRLate-demographic dividendLatin America & Caribbean Latin America & Caribbean (excluding high income)Latin America & the Caribbean (IDA & IBRD countries)LatviaLeast developed countries: UN classificationLebanonLesothoLiberiaLibyaLithuaniaLow & middle incomeLow incomeLower middle incomeLuxembourgMacao SAR, ChinaMacedonia, FYRMadagascarMalawiMalaysiaMaldivesMaliMaltaMarshall IslandsMauritaniaMauritiusMexicoMicronesia, Fed. Sts.Middle East & North AfricaMiddle East & North Africa (excluding high income)Middle East & North Africa (IDA & IBRD countries)Middle incomeMoldovaMongoliaMontenegroMoroccoMozambiqueMyanmarNamibiaNepalNetherlandsNew CaledoniaNew ZealandNicaraguaNigerNigeriaNorth AmericaNorwayOECD membersOmanOther small statesPacific island small statesPakistanPalauPanamaPapua New GuineaParaguayPeruPhilippinesPolandPortugalPost-demographic dividendPre-demographic dividendQatarRomaniaRussian FederationRwandaSamoaSao Tome and PrincipeSaudi ArabiaSenegalSerbiaSeychellesSierra LeoneSingaporeSint Maarten (Dutch part)Slovak RepublicSloveniaSmall statesSolomon IslandsSouth AfricaSouth AsiaSouth Asia (IDA & IBRD)South SudanSpainSri LankaSt. Kitts and NevisSt. LuciaSt. Vincent and the GrenadinesSub-Saharan Africa Sub-Saharan Africa (excluding high income)Sub-Saharan Africa (IDA & IBRD countries)SudanSurinameSwazilandSwedenSwitzerlandSyrian Arab RepublicTajikistanTanzaniaThailandTimor-LesteTogoTongaTrinidad and TobagoTunisiaTurkeyTuvaluUgandaUkraineUnited KingdomUnited StatesUpper middle incomeUruguayVanuatuVenezuela, RBWest Bank and GazaWorldYemen, Rep.ZambiaZimbabwe Timeline:
This timeline shows a graph from 1977 to 2016 of Argentina. No data until 1976. Number of actual observations by date: 40.
Source name:
World Development Indicators
Source organization:
International Monetary Fund, Balance of Payments Statistics Yearbook and data files.
Categories, topics:
Private Sector, Trade
Last updated:
apr 23, 2017
Indicators value changes by year
Minimum:
20.408
jan 1, 2003
Maximum:
58.503
jan 1, 1977
At the date of observation
Value
Absolute change
Change from previous value
jan 1, 1977
58.503
+58.503
0.0%
jan 1, 1978
57.214
-1.289
-2.2%
jan 1, 1979
37.045
-20.169
-35.25%
jan 1, 1980
35.81
-1.235
-3.33%
jan 1, 1981
34.918
-0.893
-2.49%
jan 1, 1982
36.006
+1.089
3.12%
jan 1, 1983
39.165
+3.159
8.77%
jan 1, 1984
36.377
-2.788
-7.12%
jan 1, 1985
41.698
+5.32
14.63%
jan 1, 1986
35.002
-6.695
-16.06%
jan 1, 1987
32.533
-2.47
-7.06%
jan 1, 1988
40.355
+7.823
24.05%
jan 1, 1989
37.556
-2.799
-6.94%
jan 1, 1990
33.781
-3.775
-10.05%
jan 1, 1991
32.58
-1.201
-3.55%
jan 1, 1992
35.739
+3.159
9.7%
jan 1, 1993
30.868
-4.871
-13.63%
jan 1, 1994
29.269
-1.598
-5.18%
jan 1, 1995
30.878
+1.608
5.49%
jan 1, 1996
30.312
-0.565
-1.83%
jan 1, 1997
31.274
+0.962
3.17%
jan 1, 1998
32.336
+1.062
3.4%
jan 1, 1999
30.826
-1.51
-4.67%
jan 1, 2000
28.284
-2.542
-8.25%
jan 1, 2001
27.383
-0.901
-3.19%
jan 1, 2002
26.081
-1.302
-4.76%
jan 1, 2003
20.408
-5.673
-21.75%
jan 1, 2004
21.51
+1.102
5.4%
jan 1, 2005
25.947
+4.438
20.63%
jan 1, 2006
27.483
+1.536
5.92%
jan 1, 2007
28.667
+1.184
4.31%
jan 1, 2008
29.335
+0.669
2.33%
jan 1, 2009
30.857
+1.522
5.19%
jan 1, 2010
23.284
-7.573
-24.54%
jan 1, 2011
26.34
+3.055
13.12%
jan 1, 2012
26.939
+0.599
2.28%
jan 1, 2013
27.203
+0.264
0.98%
jan 1, 2014
28.714
+1.511
5.55%
jan 1, 2015
25.749
-2.965
-10.33%
jan 1, 2016
25.928
+0.179
0.7%
Ranking of countries by current statistics by years


Comments: