29
/
en
AIzaSyAYiBZKx7MnpbEhh9jyipgxe19OcubqV5w
April 1, 2024
105560
Chile
CHL
true
2
1
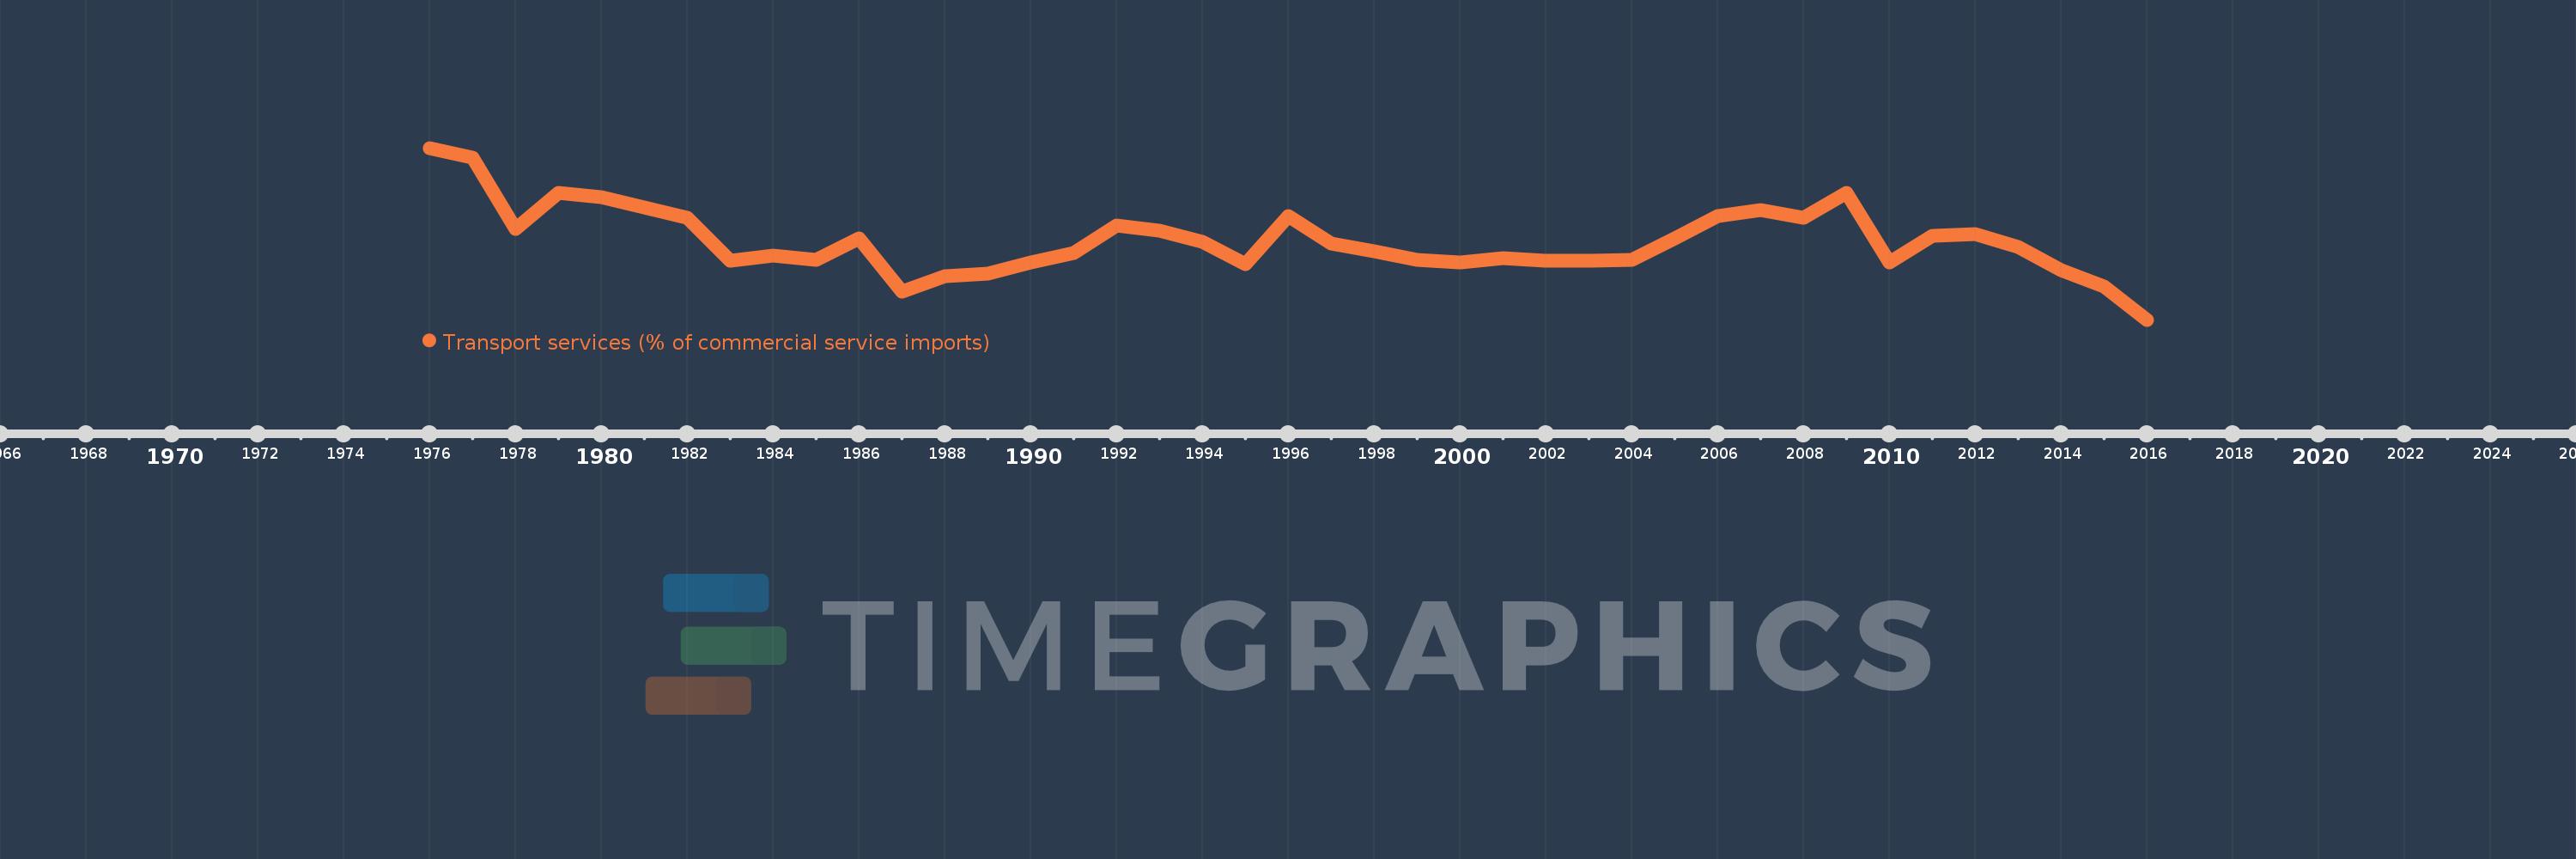
Transport services (% of commercial service imports)
2016,2015,2014,2013,2012,2011,2010,2009,2008,2007,2006,2005,2004,2003,2002,2001,2000,1999,1998,1997,1996,1995,1994,1993,1992,1991,1990,1989,1988,1987,1986,1985,1984,1983,1982,1981,1980,1979,1978,1977,1976
This statistics in other country:
AfghanistanAlbaniaAlgeriaAngolaAntigua and BarbudaArab WorldArgentinaArmeniaArubaAustraliaAustriaAzerbaijanBahamas, TheBahrainBangladeshBarbadosBelarusBelgiumBelizeBeninBermudaBhutanBoliviaBosnia and HerzegovinaBotswanaBrazilBrunei DarussalamBulgariaBurkina FasoBurundiCabo VerdeCambodiaCameroonCanadaCaribbean small statesCentral African RepublicCentral Europe and the BalticsChadChileChinaColombiaComorosCongo, Dem. Rep.Congo, Rep.Costa RicaCote d'IvoireCroatiaCuracaoCyprusCzech RepublicDenmarkDjiboutiDominicaDominican RepublicEarly-demographic dividendEast Asia & PacificEast Asia & Pacific (excluding high income)East Asia & Pacific (IDA & IBRD countries)EcuadorEgypt, Arab Rep.El SalvadorEquatorial GuineaEritreaEstoniaEthiopiaEuro areaEurope & Central AsiaEurope & Central Asia (excluding high income)Europe & Central Asia (IDA & IBRD countries)European UnionFaroe IslandsFijiFinlandFragile and conflict affected situationsFranceFrench PolynesiaGabonGambia, TheGeorgiaGermanyGhanaGreeceGrenadaGuatemalaGuineaGuinea-BissauGuyanaHaitiHeavily indebted poor countries (HIPC)High incomeHondurasHong Kong SAR, ChinaHungaryIBRD onlyIcelandIDA & IBRD totalIDA onlyIDA totalIndiaIndonesiaIran, Islamic Rep.IraqIrelandIsraelItalyJamaicaJapanJordanKazakhstanKenyaKiribatiKorea, Rep.KosovoKuwaitKyrgyz RepublicLao PDRLate-demographic dividendLatin America & Caribbean Latin America & Caribbean (excluding high income)Latin America & the Caribbean (IDA & IBRD countries)LatviaLeast developed countries: UN classificationLebanonLesothoLiberiaLibyaLithuaniaLow & middle incomeLow incomeLower middle incomeLuxembourgMacao SAR, ChinaMacedonia, FYRMadagascarMalawiMalaysiaMaldivesMaliMaltaMarshall IslandsMauritaniaMauritiusMexicoMicronesia, Fed. Sts.Middle East & North AfricaMiddle East & North Africa (excluding high income)Middle East & North Africa (IDA & IBRD countries)Middle incomeMoldovaMongoliaMontenegroMoroccoMozambiqueMyanmarNamibiaNepalNetherlandsNew CaledoniaNew ZealandNicaraguaNigerNigeriaNorth AmericaNorwayOECD membersOmanOther small statesPacific island small statesPakistanPalauPanamaPapua New GuineaParaguayPeruPhilippinesPolandPortugalPost-demographic dividendPre-demographic dividendQatarRomaniaRussian FederationRwandaSamoaSao Tome and PrincipeSaudi ArabiaSenegalSerbiaSeychellesSierra LeoneSingaporeSint Maarten (Dutch part)Slovak RepublicSloveniaSmall statesSolomon IslandsSouth AfricaSouth AsiaSouth Asia (IDA & IBRD)South SudanSpainSri LankaSt. Kitts and NevisSt. LuciaSt. Vincent and the GrenadinesSub-Saharan Africa Sub-Saharan Africa (excluding high income)Sub-Saharan Africa (IDA & IBRD countries)SudanSurinameSwazilandSwedenSwitzerlandSyrian Arab RepublicTajikistanTanzaniaThailandTimor-LesteTogoTongaTrinidad and TobagoTunisiaTurkeyTuvaluUgandaUkraineUnited KingdomUnited StatesUpper middle incomeUruguayVanuatuVenezuela, RBWest Bank and GazaWorldYemen, Rep.ZambiaZimbabwe Timeline:
This timeline shows a graph from 1976 to 2016 of Chile. No data until 1975. Number of actual observations by date: 41.
Source name:
World Development Indicators
Source organization:
International Monetary Fund, Balance of Payments Statistics Yearbook and data files.
Categories, topics:
Private Sector, Trade
Last updated:
apr 23, 2017
Indicators value changes by year
Minimum:
35.047
jan 1, 2016
At the date of observation
Value
Absolute change
Change from previous value
jan 1, 1976
66.59
+66.59
0.0%
jan 1, 1977
64.762
-1.828
-2.75%
jan 1, 1978
51.746
-13.016
-20.1%
jan 1, 1979
58.297
+6.551
12.66%
jan 1, 1980
57.526
-0.771
-1.32%
jan 1, 1981
55.63
-1.896
-3.3%
jan 1, 1982
53.819
-1.811
-3.26%
jan 1, 1983
45.948
-7.871
-14.62%
jan 1, 1984
46.864
+0.916
1.99%
jan 1, 1985
45.961
-0.903
-1.93%
jan 1, 1986
49.92
+3.959
8.61%
jan 1, 1987
40.185
-9.734
-19.5%
jan 1, 1988
42.97
+2.785
6.93%
jan 1, 1989
43.581
+0.611
1.42%
jan 1, 1990
45.628
+2.047
4.7%
jan 1, 1991
47.371
+1.743
3.82%
jan 1, 1992
52.357
+4.985
10.52%
jan 1, 1993
51.44
-0.917
-1.75%
jan 1, 1994
49.335
-2.105
-4.09%
jan 1, 1995
45.263
-4.072
-8.25%
jan 1, 1996
54.03
+8.767
19.37%
jan 1, 1997
49.045
-4.984
-9.23%
jan 1, 1998
47.553
-1.492
-3.04%
jan 1, 1999
46.1
-1.453
-3.06%
jan 1, 2000
45.495
-0.605
-1.31%
jan 1, 2001
46.359
+0.864
1.9%
jan 1, 2002
45.931
-0.428
-0.92%
jan 1, 2003
45.953
+0.022
0.05%
jan 1, 2004
46.076
+0.123
0.27%
jan 1, 2005
49.915
+3.84
8.33%
jan 1, 2006
54.16
+4.245
8.5%
jan 1, 2007
55.161
+1.001
1.85%
jan 1, 2008
53.834
-1.327
-2.41%
jan 1, 2009
58.399
+4.565
8.48%
jan 1, 2010
45.492
-12.907
-22.1%
jan 1, 2011
50.451
+4.959
10.9%
jan 1, 2012
50.784
+0.333
0.66%
jan 1, 2013
48.468
-2.316
-4.56%
jan 1, 2014
44.078
-4.39
-9.06%
jan 1, 2015
41.204
-2.874
-6.52%
jan 1, 2016
35.047
-6.157
-14.94%
Ranking of countries by current statistics by years


Comments: