29
/
en
AIzaSyAYiBZKx7MnpbEhh9jyipgxe19OcubqV5w
April 1, 2024
30368
Euro area
EMU
false
2
1
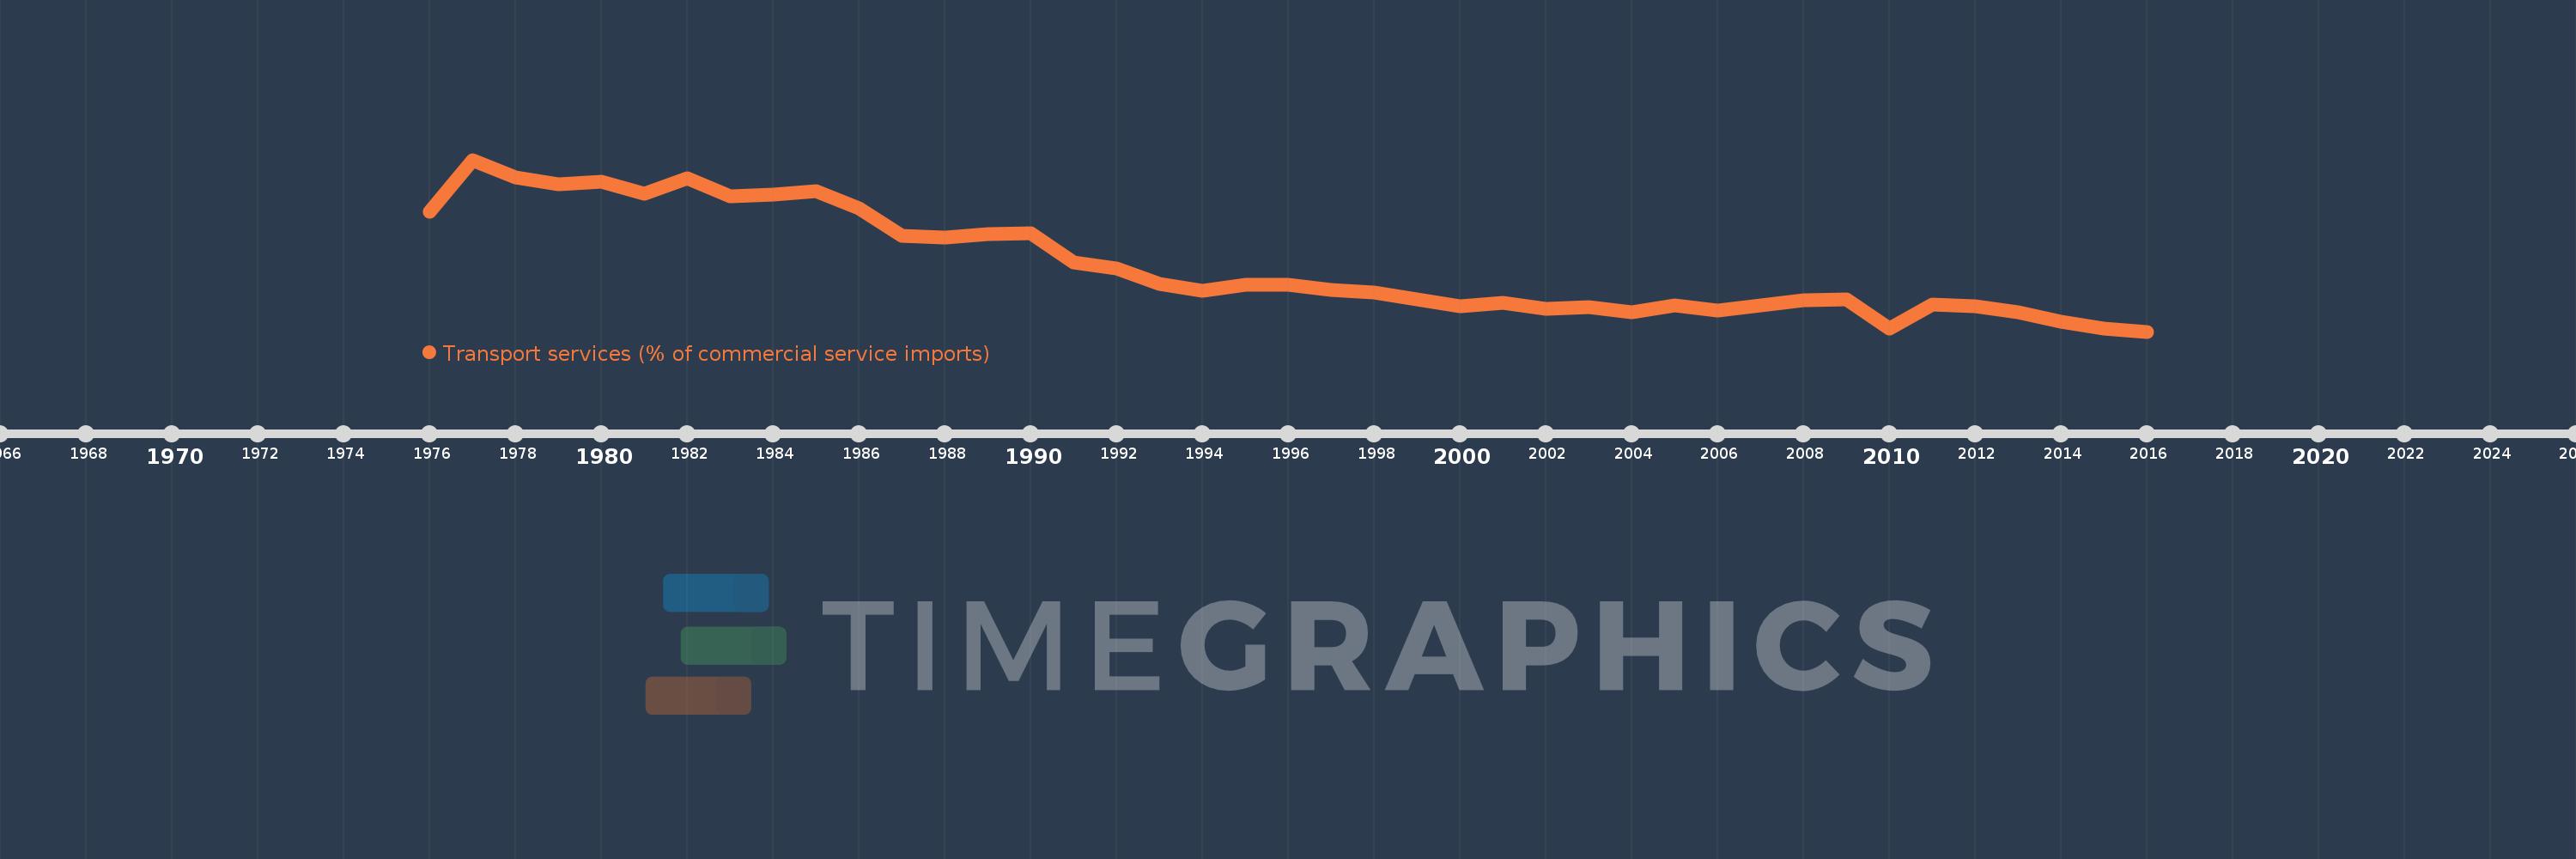
Transport services (% of commercial service imports)
2016,2015,2014,2013,2012,2011,2010,2009,2008,2007,2006,2005,2004,2003,2002,2001,2000,1999,1998,1997,1996,1995,1994,1993,1992,1991,1990,1989,1988,1987,1986,1985,1984,1983,1982,1981,1980,1979,1978,1977,1976
This statistics in other country:
AfghanistanAlbaniaAlgeriaAngolaAntigua and BarbudaArab WorldArgentinaArmeniaArubaAustraliaAustriaAzerbaijanBahamas, TheBahrainBangladeshBarbadosBelarusBelgiumBelizeBeninBermudaBhutanBoliviaBosnia and HerzegovinaBotswanaBrazilBrunei DarussalamBulgariaBurkina FasoBurundiCabo VerdeCambodiaCameroonCanadaCaribbean small statesCentral African RepublicCentral Europe and the BalticsChadChileChinaColombiaComorosCongo, Dem. Rep.Congo, Rep.Costa RicaCote d'IvoireCroatiaCuracaoCyprusCzech RepublicDenmarkDjiboutiDominicaDominican RepublicEarly-demographic dividendEast Asia & PacificEast Asia & Pacific (excluding high income)East Asia & Pacific (IDA & IBRD countries)EcuadorEgypt, Arab Rep.El SalvadorEquatorial GuineaEritreaEstoniaEthiopiaEuro areaEurope & Central AsiaEurope & Central Asia (excluding high income)Europe & Central Asia (IDA & IBRD countries)European UnionFaroe IslandsFijiFinlandFragile and conflict affected situationsFranceFrench PolynesiaGabonGambia, TheGeorgiaGermanyGhanaGreeceGrenadaGuatemalaGuineaGuinea-BissauGuyanaHaitiHeavily indebted poor countries (HIPC)High incomeHondurasHong Kong SAR, ChinaHungaryIBRD onlyIcelandIDA & IBRD totalIDA onlyIDA totalIndiaIndonesiaIran, Islamic Rep.IraqIrelandIsraelItalyJamaicaJapanJordanKazakhstanKenyaKiribatiKorea, Rep.KosovoKuwaitKyrgyz RepublicLao PDRLate-demographic dividendLatin America & Caribbean Latin America & Caribbean (excluding high income)Latin America & the Caribbean (IDA & IBRD countries)LatviaLeast developed countries: UN classificationLebanonLesothoLiberiaLibyaLithuaniaLow & middle incomeLow incomeLower middle incomeLuxembourgMacao SAR, ChinaMacedonia, FYRMadagascarMalawiMalaysiaMaldivesMaliMaltaMarshall IslandsMauritaniaMauritiusMexicoMicronesia, Fed. Sts.Middle East & North AfricaMiddle East & North Africa (excluding high income)Middle East & North Africa (IDA & IBRD countries)Middle incomeMoldovaMongoliaMontenegroMoroccoMozambiqueMyanmarNamibiaNepalNetherlandsNew CaledoniaNew ZealandNicaraguaNigerNigeriaNorth AmericaNorwayOECD membersOmanOther small statesPacific island small statesPakistanPalauPanamaPapua New GuineaParaguayPeruPhilippinesPolandPortugalPost-demographic dividendPre-demographic dividendQatarRomaniaRussian FederationRwandaSamoaSao Tome and PrincipeSaudi ArabiaSenegalSerbiaSeychellesSierra LeoneSingaporeSint Maarten (Dutch part)Slovak RepublicSloveniaSmall statesSolomon IslandsSouth AfricaSouth AsiaSouth Asia (IDA & IBRD)South SudanSpainSri LankaSt. Kitts and NevisSt. LuciaSt. Vincent and the GrenadinesSub-Saharan Africa Sub-Saharan Africa (excluding high income)Sub-Saharan Africa (IDA & IBRD countries)SudanSurinameSwazilandSwedenSwitzerlandSyrian Arab RepublicTajikistanTanzaniaThailandTimor-LesteTogoTongaTrinidad and TobagoTunisiaTurkeyTuvaluUgandaUkraineUnited KingdomUnited StatesUpper middle incomeUruguayVanuatuVenezuela, RBWest Bank and GazaWorldYemen, Rep.ZambiaZimbabwe Timeline:
This timeline shows a graph from 1976 to 2016 of Euro area. No data until 1975. Number of actual observations by date: 41.
Source name:
World Development Indicators
Source organization:
International Monetary Fund, Balance of Payments Statistics Yearbook and data files.
Categories, topics:
Private Sector, Trade
Last updated:
apr 23, 2017
Indicators value changes by year
Minimum:
21.402
jan 1, 2016
Maximum:
38.564
jan 1, 1977
At the date of observation
Value
Absolute change
Change from previous value
jan 1, 1976
33.387
+33.387
0.0%
jan 1, 1977
38.564
+5.177
15.51%
jan 1, 1978
36.806
-1.758
-4.56%
jan 1, 1979
36.083
-0.723
-1.97%
jan 1, 1980
36.402
+0.319
0.88%
jan 1, 1981
35.203
-1.199
-3.29%
jan 1, 1982
36.707
+1.504
4.27%
jan 1, 1983
34.929
-1.778
-4.84%
jan 1, 1984
35.09
+0.161
0.46%
jan 1, 1985
35.408
+0.318
0.91%
jan 1, 1986
33.711
-1.697
-4.79%
jan 1, 1987
30.929
-2.782
-8.25%
jan 1, 1988
30.774
-0.155
-0.5%
jan 1, 1989
31.12
+0.346
1.12%
jan 1, 1990
31.211
+0.091
0.29%
jan 1, 1991
28.267
-2.943
-9.43%
jan 1, 1992
27.69
-0.578
-2.04%
jan 1, 1993
26.179
-1.511
-5.46%
jan 1, 1994
25.466
-0.713
-2.73%
jan 1, 1995
26.089
+0.624
2.45%
jan 1, 1996
26.083
-0.006
-0.02%
jan 1, 1997
25.544
-0.54
-2.07%
jan 1, 1998
25.277
-0.266
-1.04%
jan 1, 1999
24.652
-0.626
-2.48%
jan 1, 2000
23.942
-0.709
-2.88%
jan 1, 2001
24.316
+0.373
1.56%
jan 1, 2002
23.705
-0.61
-2.51%
jan 1, 2003
23.842
+0.137
0.58%
jan 1, 2004
23.329
-0.514
-2.15%
jan 1, 2005
24.03
+0.702
3.01%
jan 1, 2006
23.529
-0.501
-2.09%
jan 1, 2007
24.056
+0.527
2.24%
jan 1, 2008
24.518
+0.462
1.92%
jan 1, 2009
24.583
+0.065
0.26%
jan 1, 2010
21.67
-2.913
-11.85%
jan 1, 2011
24.074
+2.404
11.09%
jan 1, 2012
23.891
-0.183
-0.76%
jan 1, 2013
23.349
-0.542
-2.27%
jan 1, 2014
22.414
-0.935
-4.0%
jan 1, 2015
21.707
-0.707
-3.15%
jan 1, 2016
21.402
-0.305
-1.4%
Ranking of countries by current statistics by years


Comments: