29
/
en
AIzaSyAYiBZKx7MnpbEhh9jyipgxe19OcubqV5w
April 1, 2024
267503
Trinidad and Tobago
TTO
true
2
1
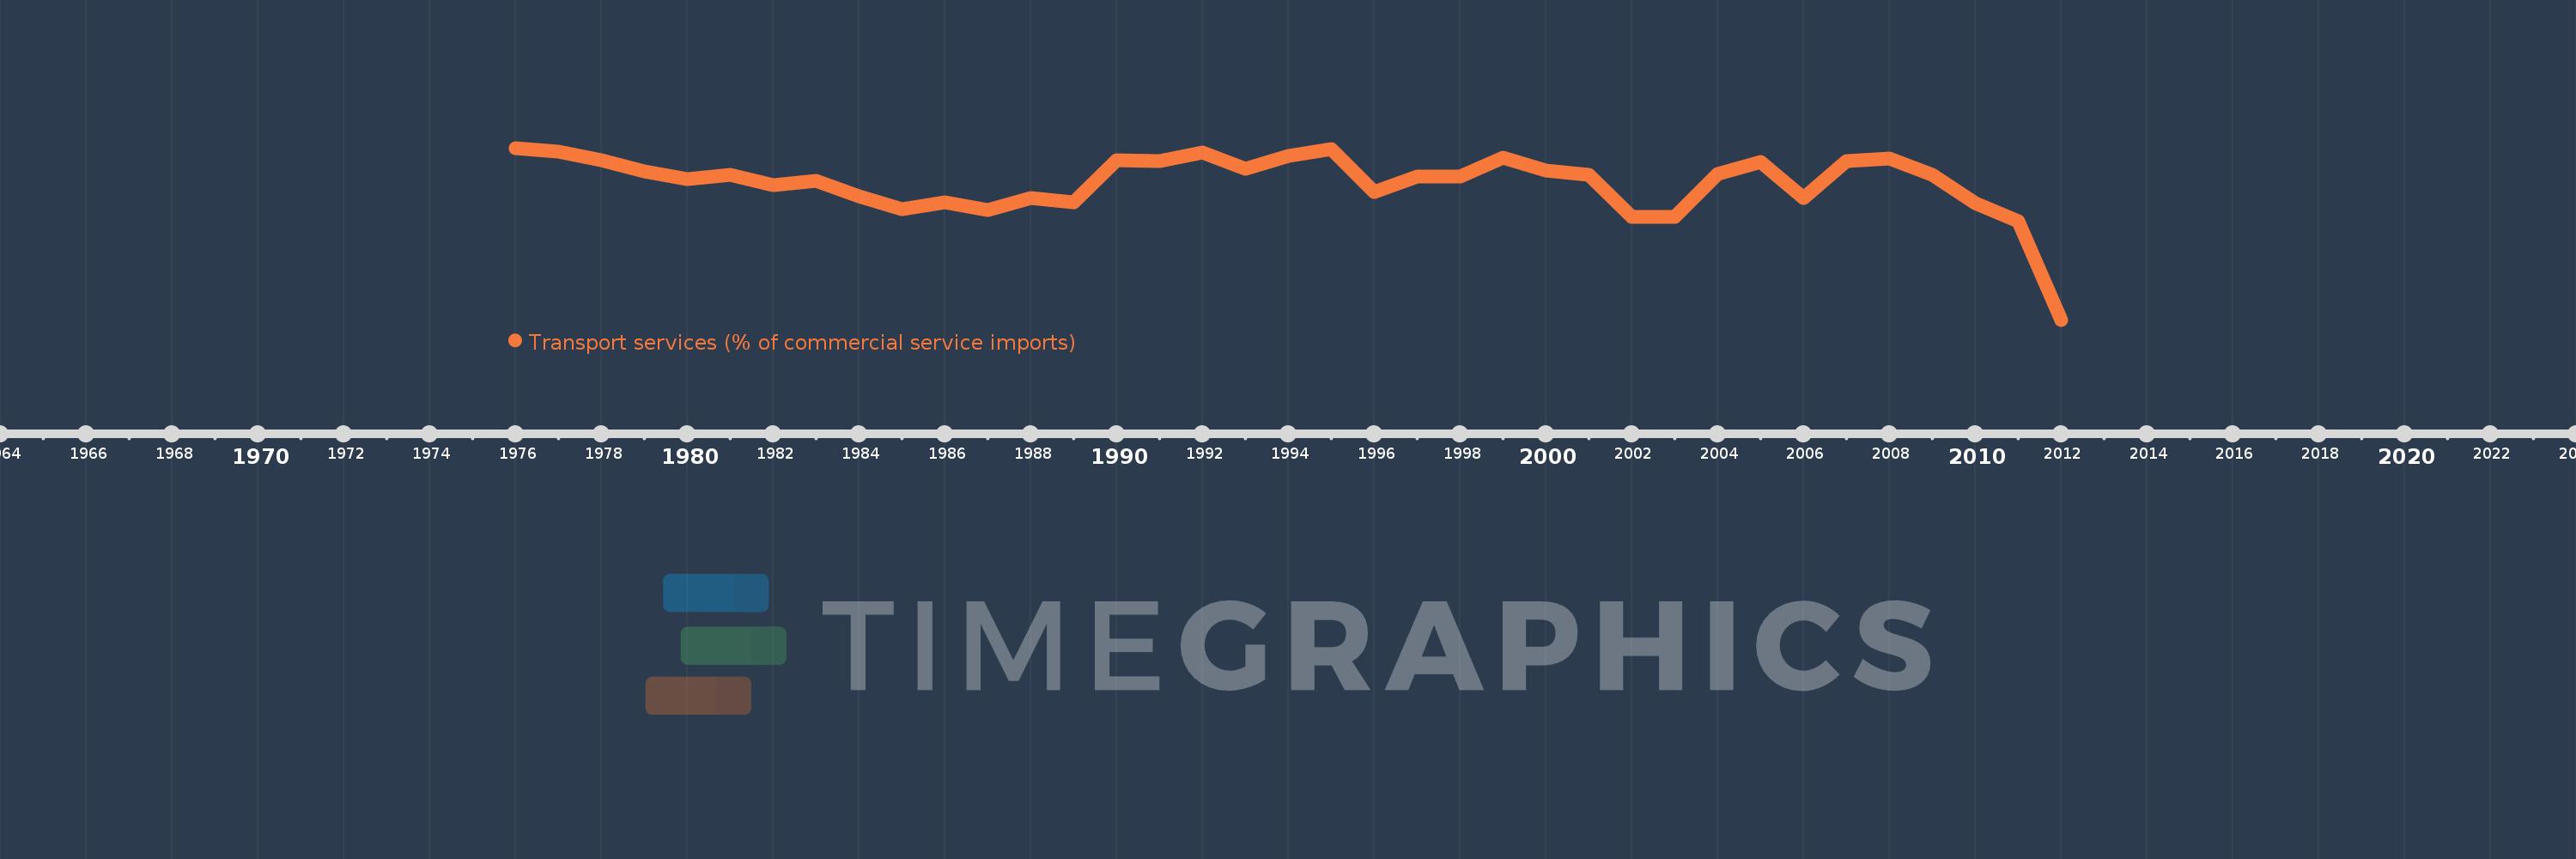
Transport services (% of commercial service imports)
2012,2011,2010,2009,2008,2007,2006,2005,2004,2003,2002,2001,2000,1999,1998,1997,1996,1995,1994,1993,1992,1991,1990,1989,1988,1987,1986,1985,1984,1983,1982,1981,1980,1979,1978,1977,1976
This statistics in other country:
AfghanistanAlbaniaAlgeriaAngolaAntigua and BarbudaArab WorldArgentinaArmeniaArubaAustraliaAustriaAzerbaijanBahamas, TheBahrainBangladeshBarbadosBelarusBelgiumBelizeBeninBermudaBhutanBoliviaBosnia and HerzegovinaBotswanaBrazilBrunei DarussalamBulgariaBurkina FasoBurundiCabo VerdeCambodiaCameroonCanadaCaribbean small statesCentral African RepublicCentral Europe and the BalticsChadChileChinaColombiaComorosCongo, Dem. Rep.Congo, Rep.Costa RicaCote d'IvoireCroatiaCuracaoCyprusCzech RepublicDenmarkDjiboutiDominicaDominican RepublicEarly-demographic dividendEast Asia & PacificEast Asia & Pacific (excluding high income)East Asia & Pacific (IDA & IBRD countries)EcuadorEgypt, Arab Rep.El SalvadorEquatorial GuineaEritreaEstoniaEthiopiaEuro areaEurope & Central AsiaEurope & Central Asia (excluding high income)Europe & Central Asia (IDA & IBRD countries)European UnionFaroe IslandsFijiFinlandFragile and conflict affected situationsFranceFrench PolynesiaGabonGambia, TheGeorgiaGermanyGhanaGreeceGrenadaGuatemalaGuineaGuinea-BissauGuyanaHaitiHeavily indebted poor countries (HIPC)High incomeHondurasHong Kong SAR, ChinaHungaryIBRD onlyIcelandIDA & IBRD totalIDA onlyIDA totalIndiaIndonesiaIran, Islamic Rep.IraqIrelandIsraelItalyJamaicaJapanJordanKazakhstanKenyaKiribatiKorea, Rep.KosovoKuwaitKyrgyz RepublicLao PDRLate-demographic dividendLatin America & Caribbean Latin America & Caribbean (excluding high income)Latin America & the Caribbean (IDA & IBRD countries)LatviaLeast developed countries: UN classificationLebanonLesothoLiberiaLibyaLithuaniaLow & middle incomeLow incomeLower middle incomeLuxembourgMacao SAR, ChinaMacedonia, FYRMadagascarMalawiMalaysiaMaldivesMaliMaltaMarshall IslandsMauritaniaMauritiusMexicoMicronesia, Fed. Sts.Middle East & North AfricaMiddle East & North Africa (excluding high income)Middle East & North Africa (IDA & IBRD countries)Middle incomeMoldovaMongoliaMontenegroMoroccoMozambiqueMyanmarNamibiaNepalNetherlandsNew CaledoniaNew ZealandNicaraguaNigerNigeriaNorth AmericaNorwayOECD membersOmanOther small statesPacific island small statesPakistanPalauPanamaPapua New GuineaParaguayPeruPhilippinesPolandPortugalPost-demographic dividendPre-demographic dividendQatarRomaniaRussian FederationRwandaSamoaSao Tome and PrincipeSaudi ArabiaSenegalSerbiaSeychellesSierra LeoneSingaporeSint Maarten (Dutch part)Slovak RepublicSloveniaSmall statesSolomon IslandsSouth AfricaSouth AsiaSouth Asia (IDA & IBRD)South SudanSpainSri LankaSt. Kitts and NevisSt. LuciaSt. Vincent and the GrenadinesSub-Saharan Africa Sub-Saharan Africa (excluding high income)Sub-Saharan Africa (IDA & IBRD countries)SudanSurinameSwazilandSwedenSwitzerlandSyrian Arab RepublicTajikistanTanzaniaThailandTimor-LesteTogoTongaTrinidad and TobagoTunisiaTurkeyTuvaluUgandaUkraineUnited KingdomUnited StatesUpper middle incomeUruguayVanuatuVenezuela, RBWest Bank and GazaWorldYemen, Rep.ZambiaZimbabwe Timeline:
This timeline shows a graph from 1976 to 2012 of Trinidad and Tobago. No data until 1975. Number of actual observations by date: 37.
Source name:
World Development Indicators
Source organization:
International Monetary Fund, Balance of Payments Statistics Yearbook and data files.
Categories, topics:
Private Sector, Trade
Last updated:
apr 23, 2017
Indicators value changes by year
Maximum:
55.836
jan 1, 1976
At the date of observation
Value
Absolute change
Change from previous value
jan 1, 1976
55.836
+55.836
0.0%
jan 1, 1977
54.685
-1.151
-2.06%
jan 1, 1978
51.967
-2.718
-4.97%
jan 1, 1979
48.451
-3.515
-6.76%
jan 1, 1980
46.065
-2.386
-4.92%
jan 1, 1981
47.43
+1.365
2.96%
jan 1, 1982
44.266
-3.164
-6.67%
jan 1, 1983
45.637
+1.371
3.1%
jan 1, 1984
40.839
-4.799
-10.51%
jan 1, 1985
36.791
-4.048
-9.91%
jan 1, 1986
39.074
+2.283
6.21%
jan 1, 1987
36.654
-2.42
-6.19%
jan 1, 1988
40.334
+3.68
10.04%
jan 1, 1989
39.084
-1.25
-3.1%
jan 1, 1990
51.997
+12.913
33.04%
jan 1, 1991
51.666
-0.331
-0.64%
jan 1, 1992
54.331
+2.665
5.16%
jan 1, 1993
49.426
-4.905
-9.03%
jan 1, 1994
53.254
+3.828
7.75%
jan 1, 1995
55.485
+2.232
4.19%
jan 1, 1996
42.19
-13.295
-23.96%
jan 1, 1997
47.085
+4.895
11.6%
jan 1, 1998
47.09
+0.005
0.01%
jan 1, 1999
52.735
+5.645
11.99%
jan 1, 2000
48.834
-3.901
-7.4%
jan 1, 2001
47.582
-1.252
-2.56%
jan 1, 2002
34.385
-13.197
-27.74%
jan 1, 2003
34.499
+0.114
0.33%
jan 1, 2004
47.651
+13.152
38.12%
jan 1, 2005
51.41
+3.758
7.89%
jan 1, 2006
40.32
-11.089
-21.57%
jan 1, 2007
51.658
+11.337
28.12%
jan 1, 2008
52.585
+0.927
1.8%
jan 1, 2009
47.421
-5.164
-9.82%
jan 1, 2010
38.799
-8.621
-18.18%
jan 1, 2011
33.261
-5.538
-14.27%
jan 1, 2012
2.642
-30.619
-92.06%
Ranking of countries by current statistics by years


Comments: